The Shape of DeFi
Part 1 of 3: Mapping by Function
Since December 2025, Chainlabs has labelled and graded the smart contracts and on-chain entities that run more than 3,000 DeFi protocols:
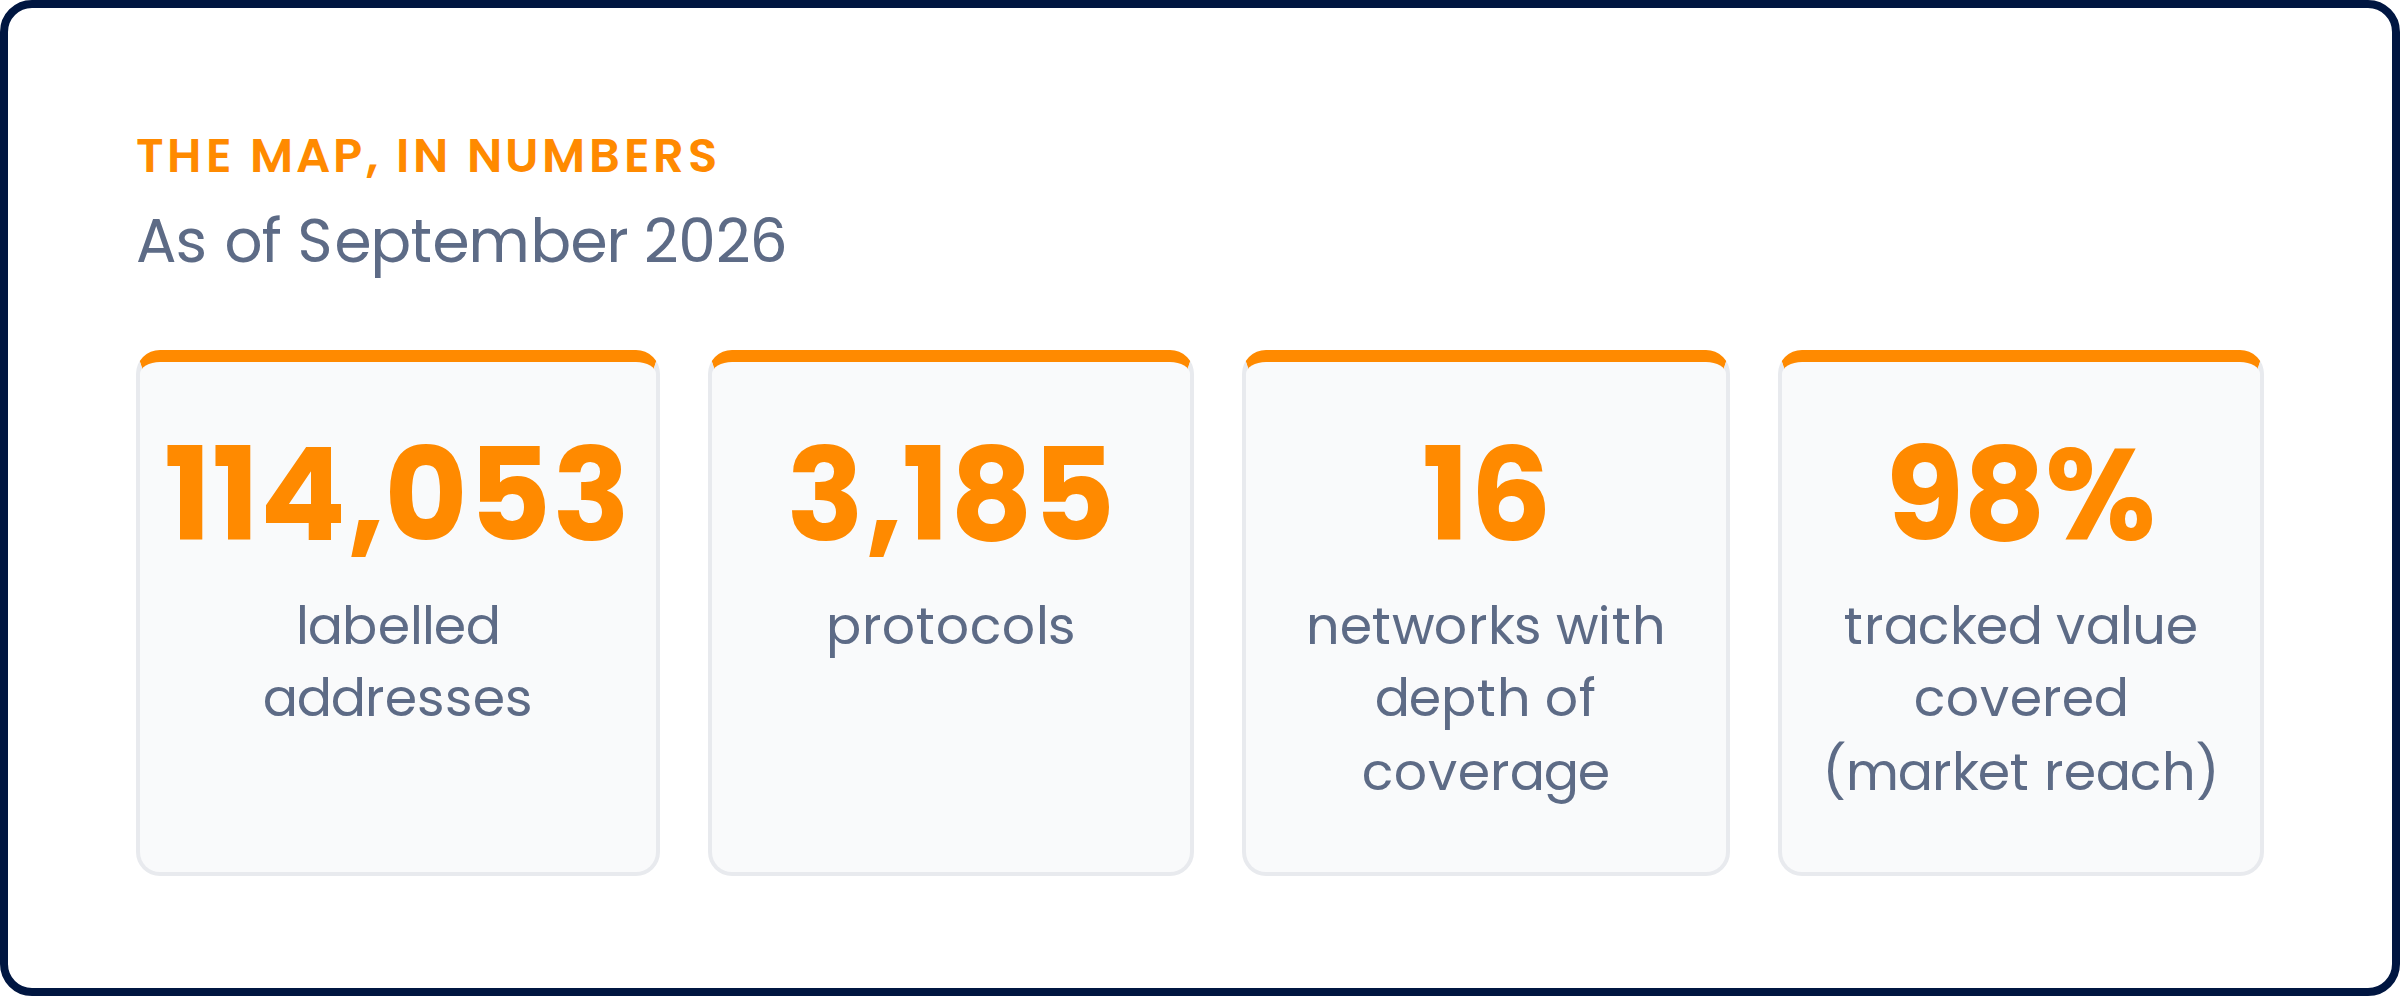
Coverage is essential: you can't rank what you can't see. But in DeFi, a large coverage number alone can mislead, because it doesn't show which protocols matter. That's the job of ranking, and it's where most trackers run into trouble.
The Ranking Problem
The conventional approach to categorising DeFi prioritises where the money is. But ranking only by dollar value hides the ecosystem's real structure. When protocols are ranked purely by the amount of crypto deposited at any moment (total value locked, or TVL), the same names move up and down the list every month. The ranking reflects balances on the day, not what protocols do.
Some protocols hold very little money themselves but keep much larger ones running. Think of a company supplying live stock prices to trading apps: it holds almost none of the money being traded, yet every trade depends on its numbers. Ranked by value held, it barely registers.
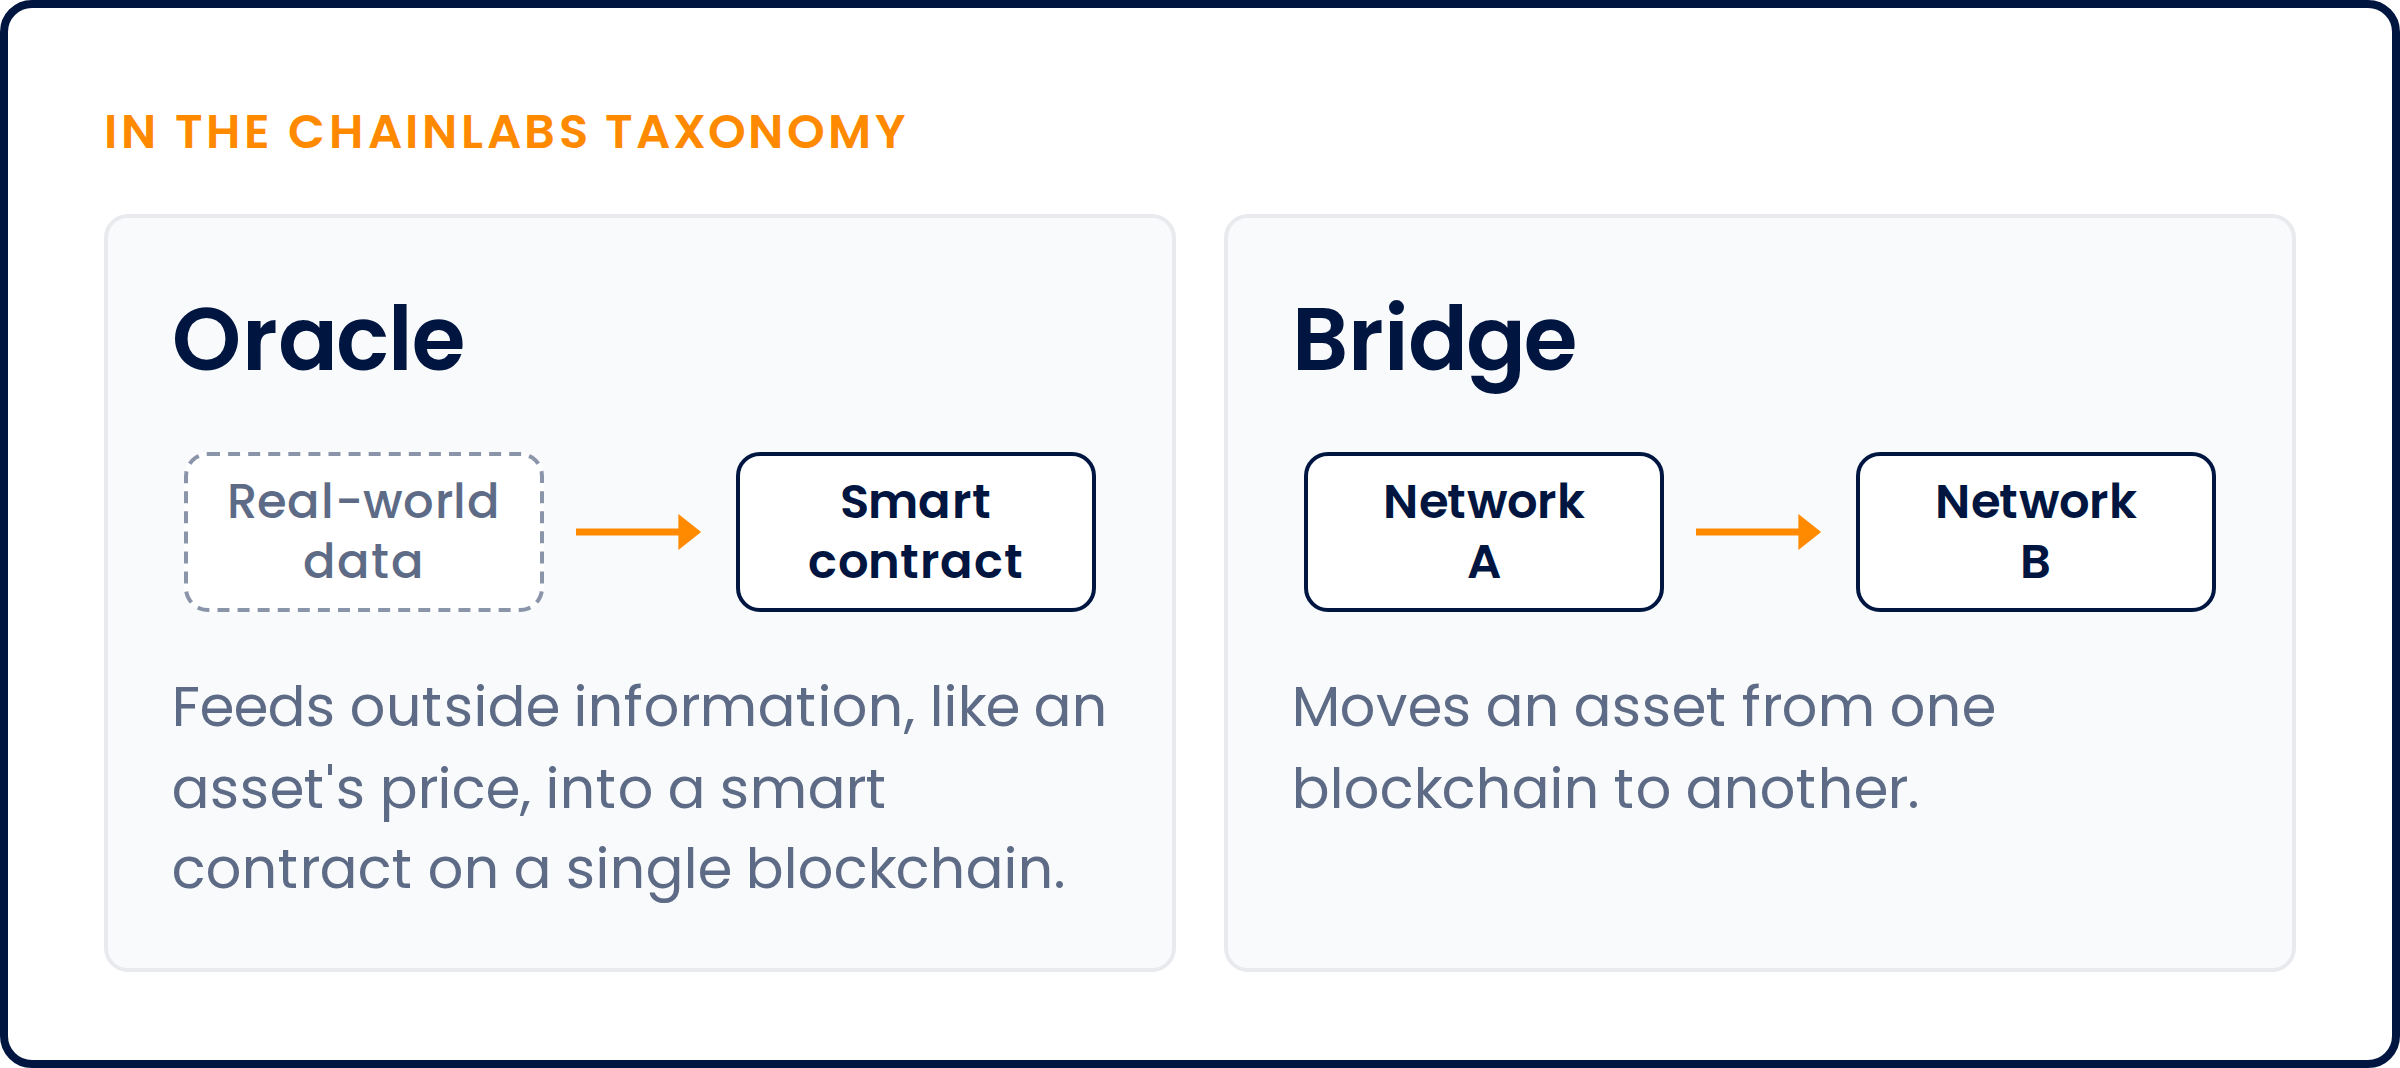
In DeFi, these are called oracles: services that feed outside information, such as asset prices, into smart contracts. Alongside bridges, which move assets between blockchains, they are the furthest-reaching categories in our catalogue, and the ones value-ranked lists barely show. Of the 13 protocols we track that run on a dozen or more blockchains, 11 are oracles or bridges.
Bridges, unlike oracles, hold value, but far less than they put at risk. In April 2026, attackers exploited KelpDAO's bridge for around $292 million, then used the stolen rsETH, a token widely used as collateral across DeFi, to borrow from lending platforms. Because the stolen tokens had no backing, lenders faced potential bad debt, and protocols froze the affected markets. Within 48 hours, users withdrew $8.45 billion from Aave, DeFi's largest lending protocol. Total DeFi TVL fell by $13.21 billion. Ranking by locked value alone misses that reach.
What that costs depends on how you use the data. For compliance, a value-ranked view under-weights contracts that move or support value without holding it, such as bridges and oracles. This means the most operationally important contracts can be underprioritised. For market intelligence, a ranking that reshuffles as prices move makes ordinary asset flows look like structural change. Value-based rankings can even overstate what's there. After the KelpDAO exploit, CoinDesk noted that much of Aave's ETH lending was tied up in looping: users deposited restaking tokens like rsETH, borrowed ETH against them, swapped it for more restaking tokens, and then repeated the cycle. The same assets may be counted multiple times in TVL figures.
Function over Value
We approached this problem differently, starting with two basic questions: what actually exists, and how reliably can we identify it?
Grouping protocols by Chainlabs' taxonomy, our classification system for what each protocol does, gives a structural map of DeFi organised by function rather than assets held. Each entry gets a label (what it is) and a confidence grade (how sure we are). 'Confirmed' means the label is backed by a document published by the protocol itself, an archived source anyone can look up, or an on-chain check anyone can repeat. 'High-confidence inference' means a strong, consistent pattern with no contradictions. Anything still being tested is marked as a working hypothesis and never published as final.
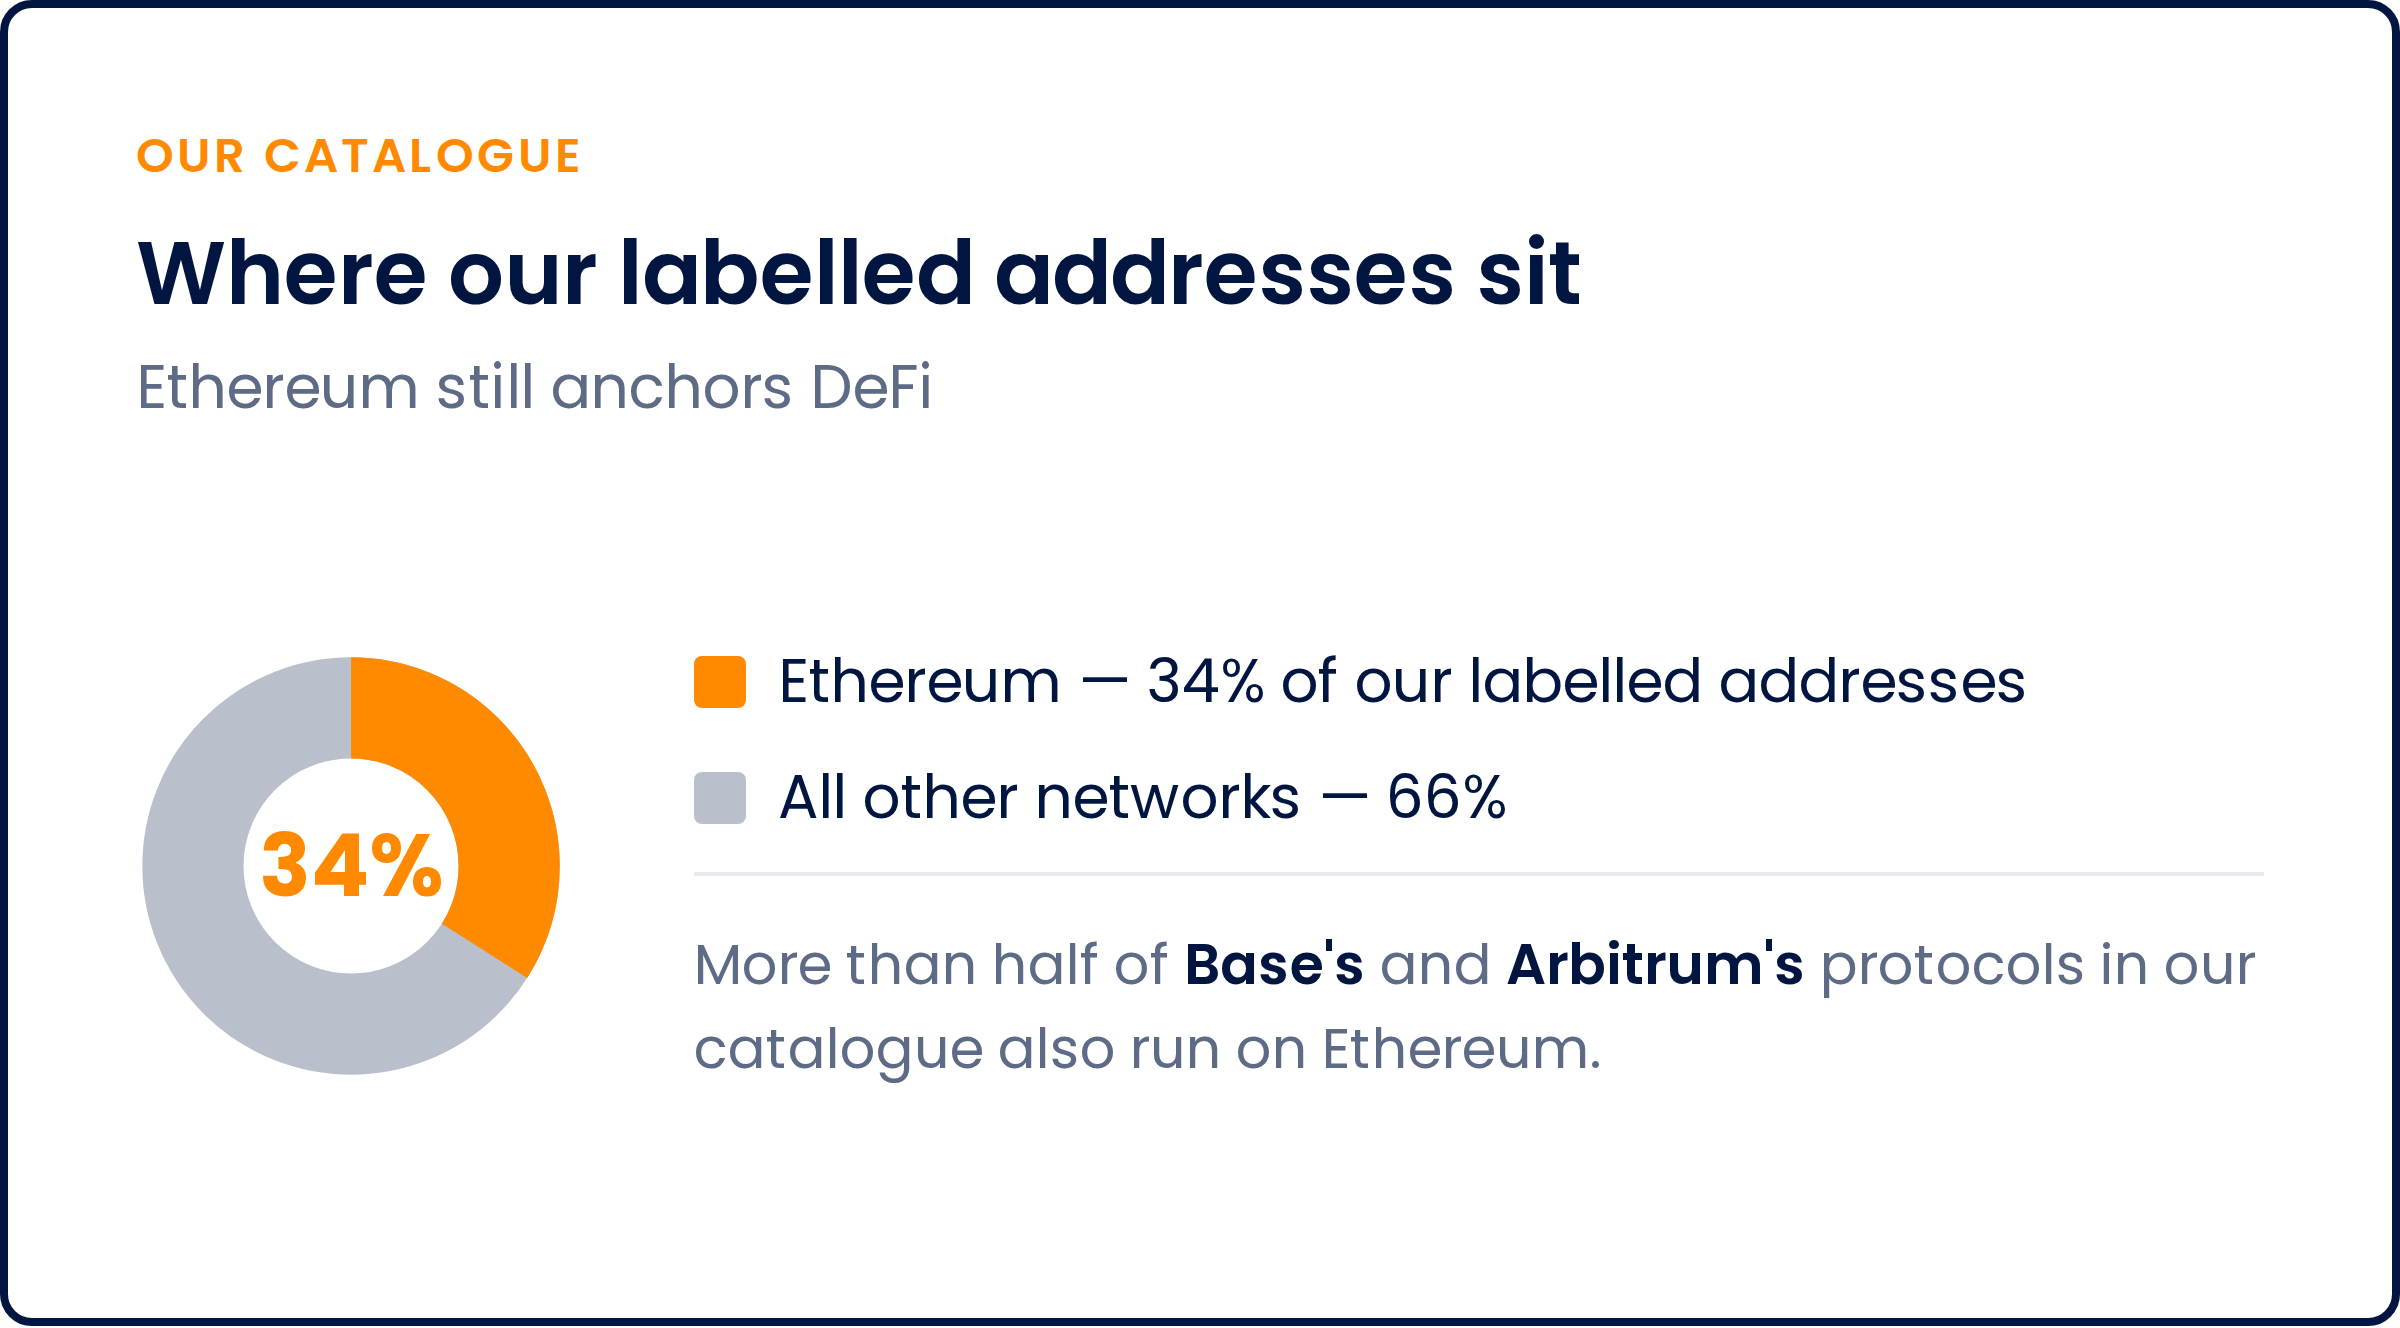
Catalogue Snapshot
Looking Ahead
Our mapping provides a baseline for coverage but is not the full picture. DeFi's on-chain structure is the easiest layer to verify, making it the right place to start. The map hints at money moving to or from exchanges, darknet markets, and sanctioned entities, but it can't confirm those links on its own. Seeing them clearly requires evidence a smart contract cannot provide. In our next instalment, we follow illicit funds through cross-chain bridges and look at why some don't stay long.
The Shape of DeFi is a three-part series built on Chainlabs' internal taxonomy. Figures are accurate as of late September 2026.
Research & Data: Martín Jofré & Guillaume Donnet
Editorial: Scott Mallen