REPORTS
The Shape of DeFi (III)
Attributing by Actor
Read more
Built on the Chainlabs internal taxonomy
The series at a glance
PART I OF III
Ranking DeFi by the money it holds hides how it works.
In short: Ranking DeFi by the money it holds hides how it works. Since December 2025, Chainlabs has labelled 114,053 addresses across 3,185 protocols on 16 networks, covering 98% of tracked value. Grouped by what protocols do rather than what they hold, the map shows that oracles and bridges reach furthest. Eleven of the 13 protocols we track on a dozen or more blockchains are one or the other. The KelpDAO bridge exploit in April 2026 showed what that reach can put at risk.
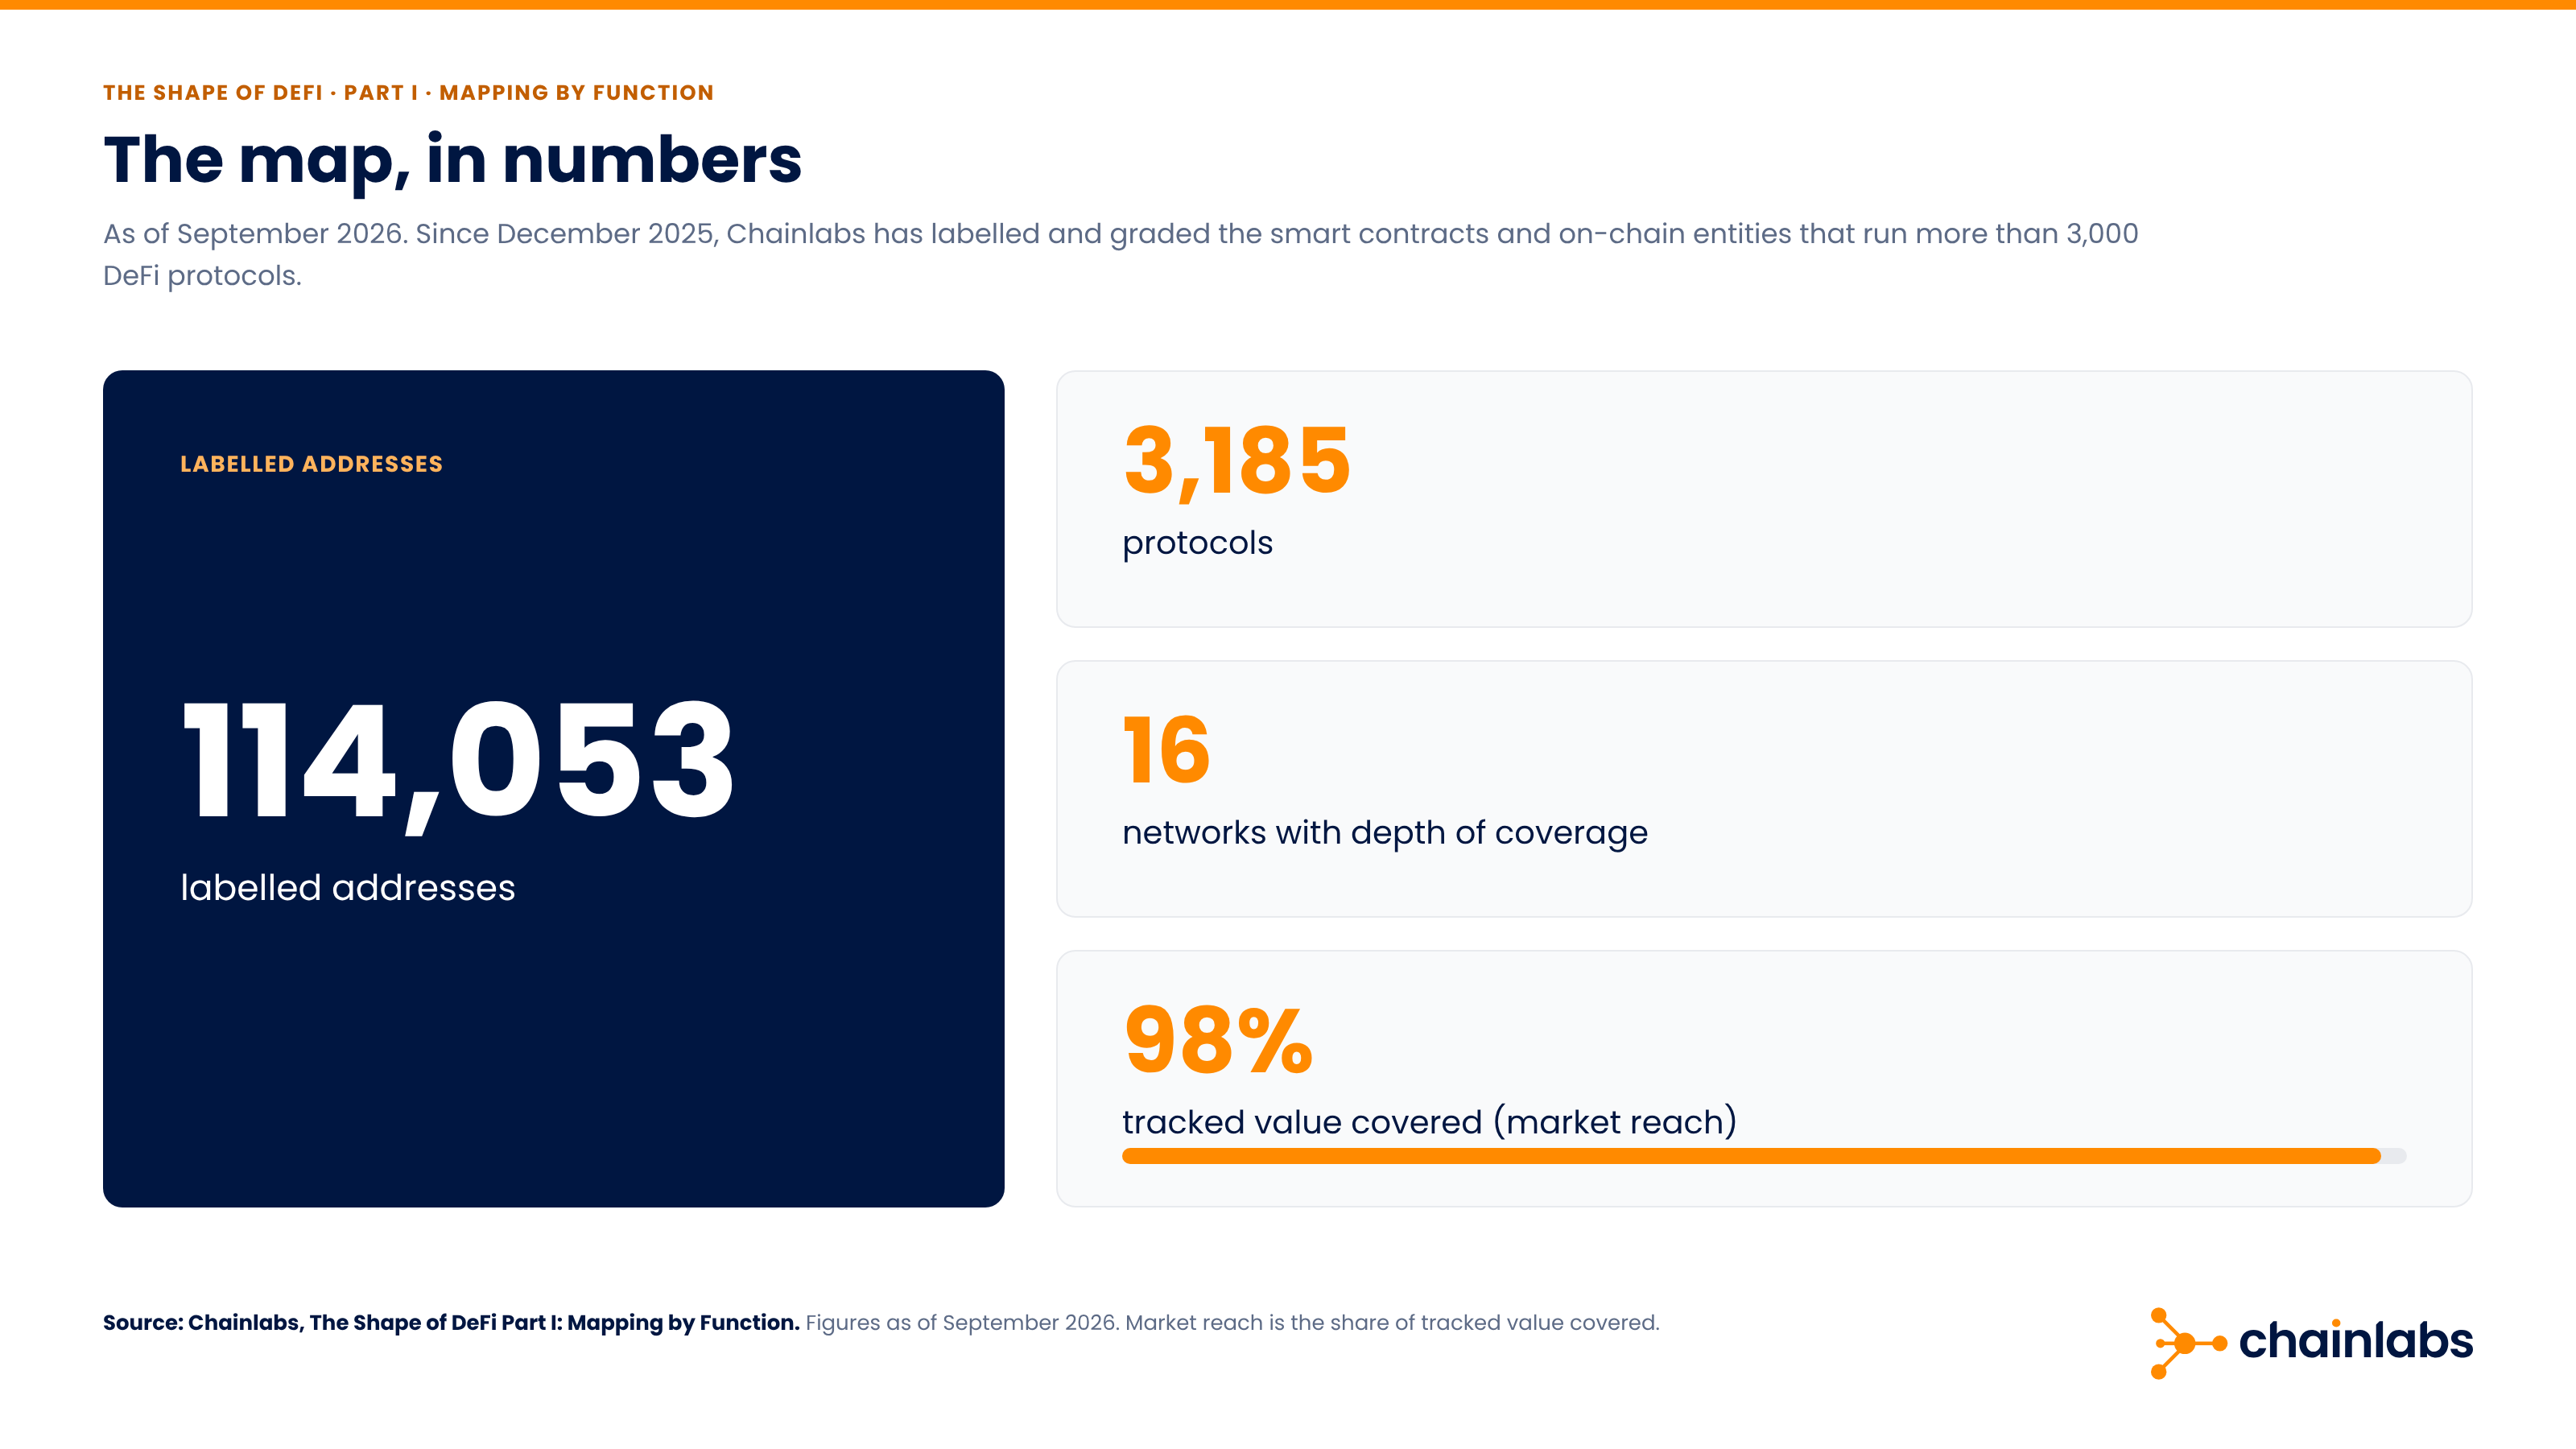
Since December 2025, Chainlabs has labelled and graded the smart contracts and on-chain entities that run more than 3,000 DeFi protocols:
Coverage is essential: you can't rank what you can't see. But in DeFi, a large coverage number alone can mislead, because it doesn't show which protocols matter. That's the job of ranking, and it's where things get harder.
Because ranking only by dollar value hides the ecosystem's real structure. The conventional approach to categorising DeFi prioritises where the money is. When protocols are ranked purely by the amount of crypto deposited at any moment (total value locked, or TVL), the same names move up and down the list every month. The ranking reflects balances on the day, not what protocols do.
Some protocols hold very little money themselves but keep much larger ones running. Think of a company supplying live stock prices to trading apps: it holds almost none of the money being traded, yet every trade depends on its numbers. Ranked by value held, it barely registers.
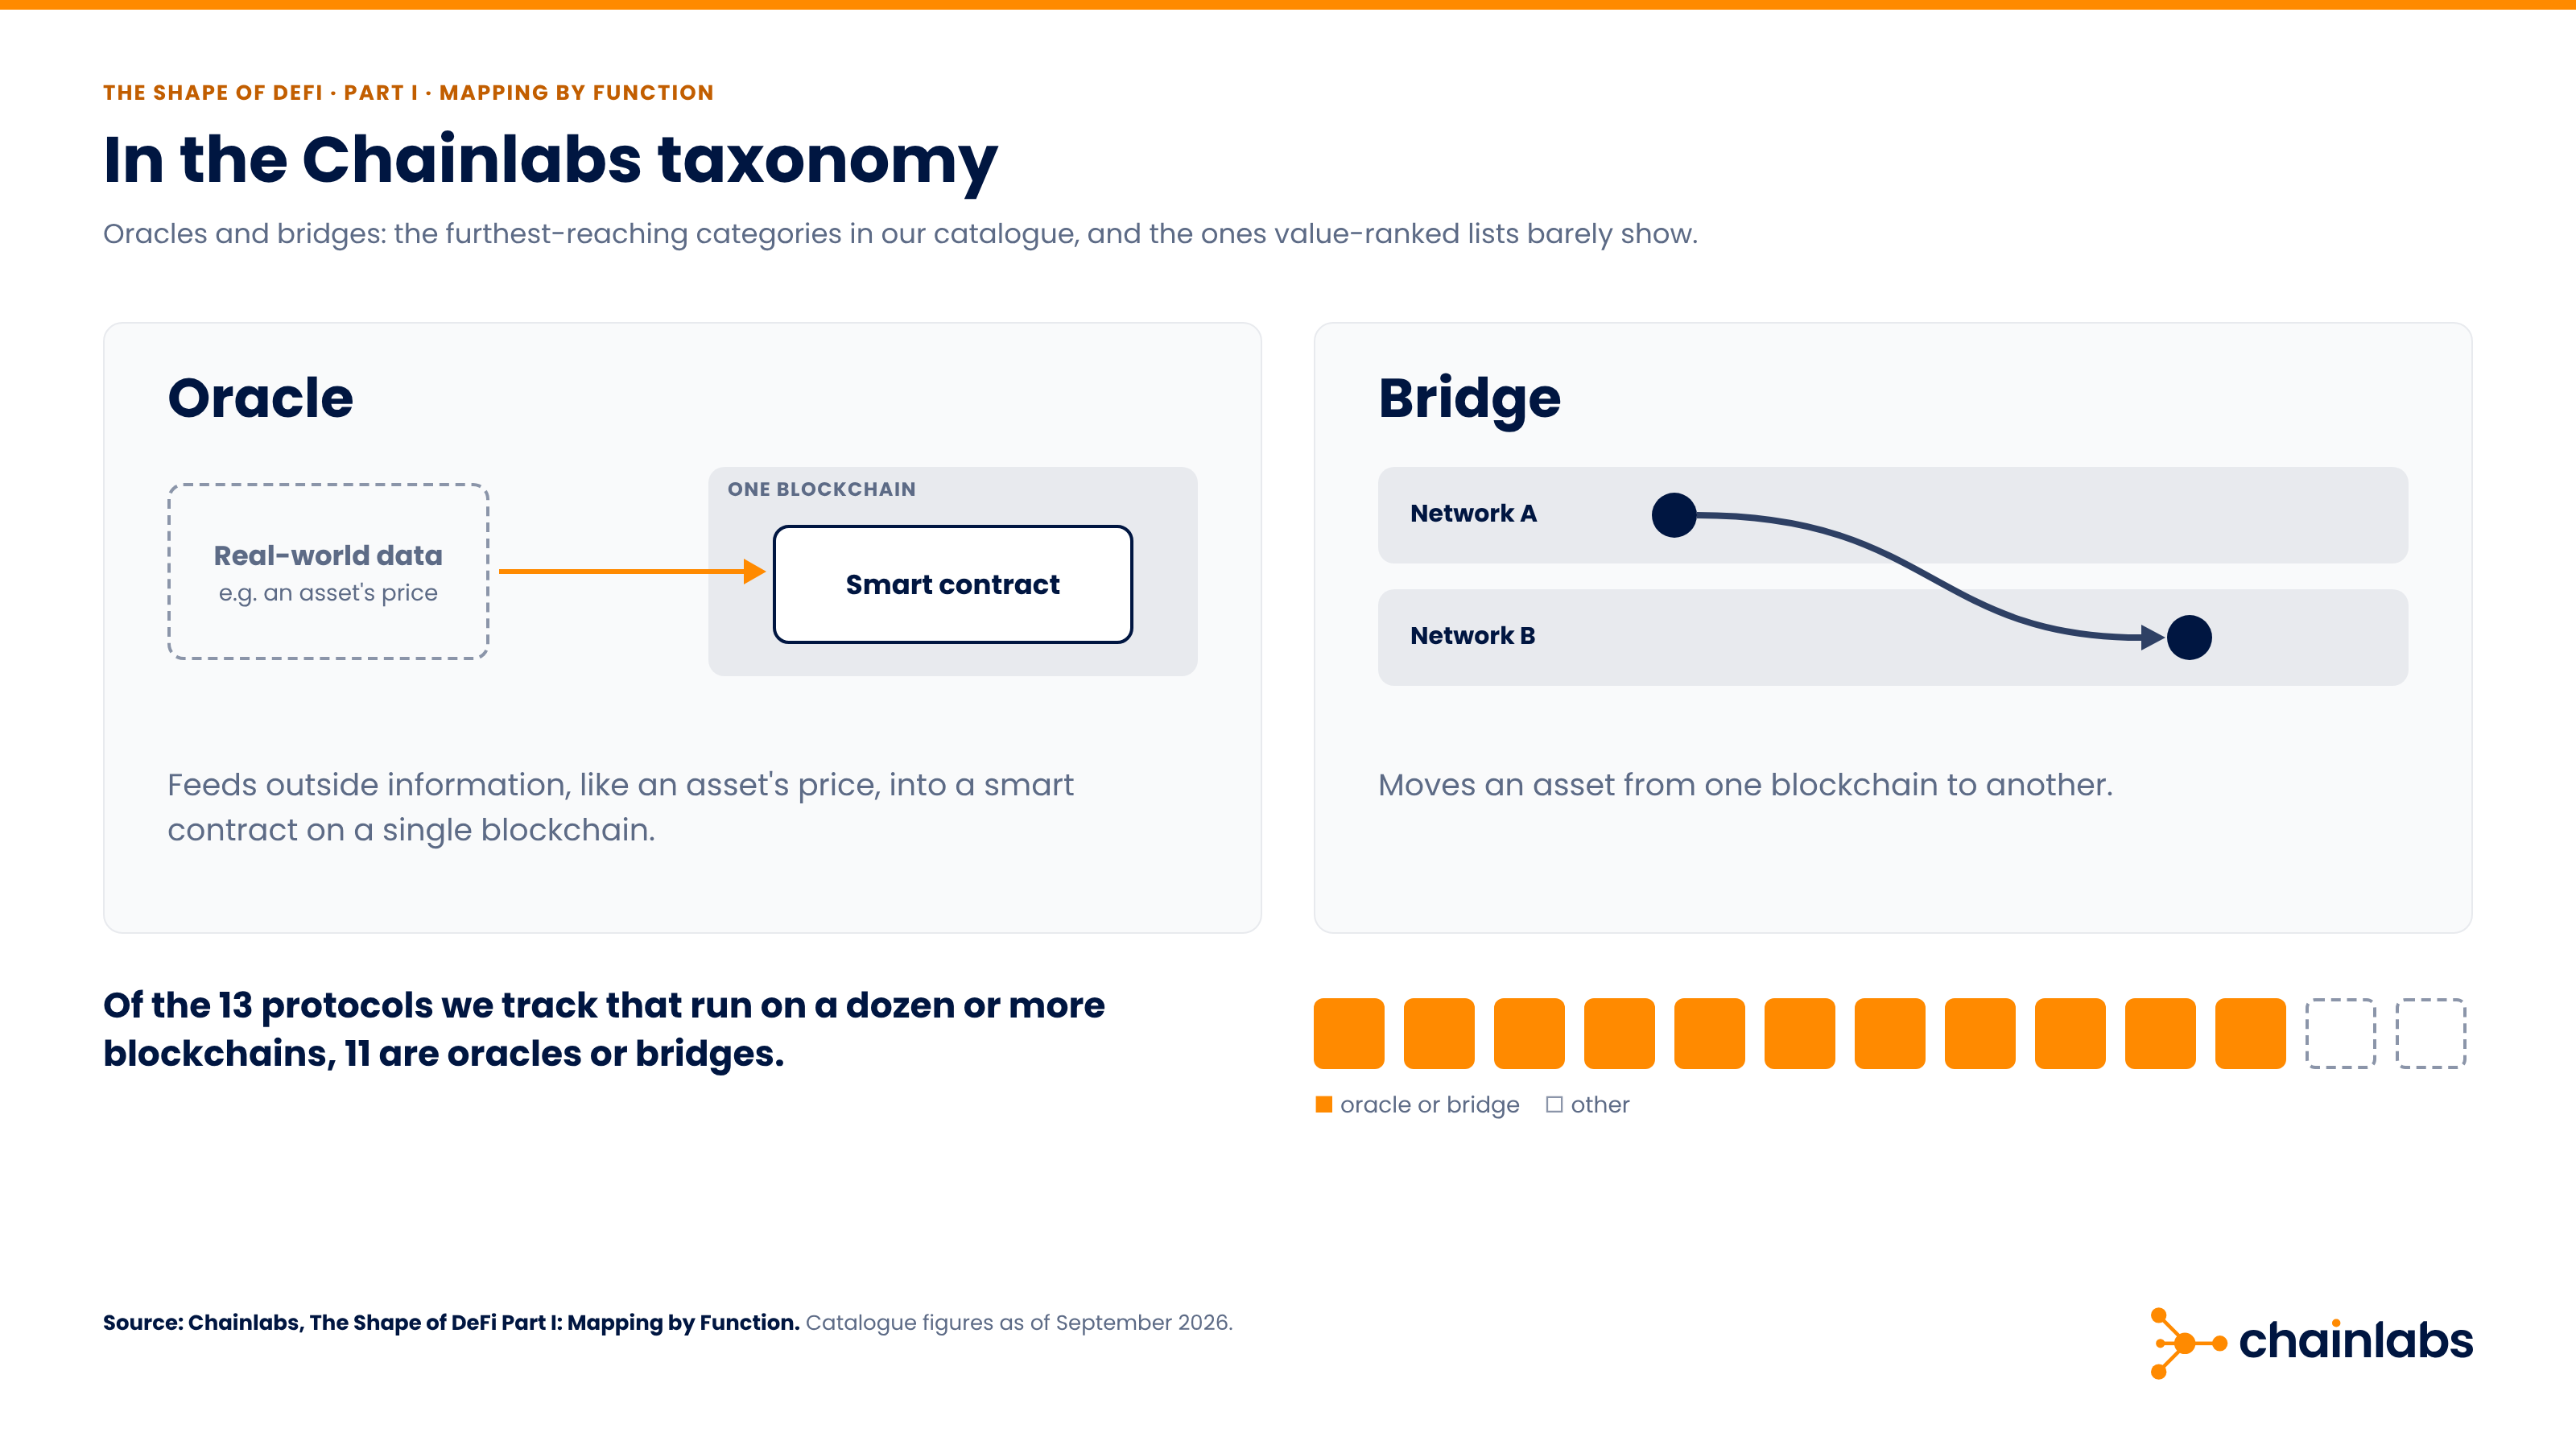
In DeFi, these are called oracles: services that feed outside information, such as asset prices, into smart contracts. Alongside bridges, which move assets between blockchains, they are the furthest-reaching categories in our catalogue, and the ones value-ranked lists barely show. Of the 13 protocols we track that run on a dozen or more blockchains, 11 are oracles or bridges.
Bridges, unlike oracles, hold value, but far less than they put at risk. In April 2026, attackers exploited KelpDAO's bridge for around $292 million, then used the stolen rsETH, a token widely used as collateral across DeFi, to borrow from lending platforms. Because the stolen tokens had no backing, lenders faced potential bad debt, and protocols froze the affected markets. Within 48 hours, Aave, DeFi's largest lending protocol, lost $8.45 billion in deposits. Total DeFi TVL fell by $13.21 billion. Ranking by locked value alone misses that reach.
It depends on how you use the data. For compliance, a value-ranked view under-weights contracts that move or support value without holding it, such as bridges and oracles. This means the most operationally important contracts can be underprioritised. For market intelligence, a ranking that reshuffles as prices move makes ordinary asset flows look like structural change. Value-based rankings can even overstate what's there. After the KelpDAO exploit, CoinDesk noted that much of Aave's ETH lending was tied up in looping: users deposited restaking tokens like rsETH, borrowed ETH against them, swapped it for more restaking tokens, and then repeated the cycle. The same assets may be counted multiple times in TVL figures.
By function rather than by value. We started with two basic questions: what actually exists, and how reliably can we identify it?
Grouping protocols by Chainlabs' taxonomy, our classification system for what each protocol does, gives a structural map of DeFi organised by function rather than assets held. Each entry gets a label (what it is) and a confidence grade (how sure we are). 'Confirmed' means the label is backed by a document published by the protocol itself, an archived source anyone can look up, or an on-chain check anyone can repeat. 'High-confidence inference' means a strong, consistent pattern with no contradictions. Anything still being tested is marked as a working hypothesis and never published as final.
"An oracle can hold almost nothing and still sit underneath billions of dollars of lending. Rank DeFi by value, and it comes near the bottom. Rank it by what stops working when it fails, and it's near the top," says Guillaume Donnet, Solutions Analyst at Chainlabs.
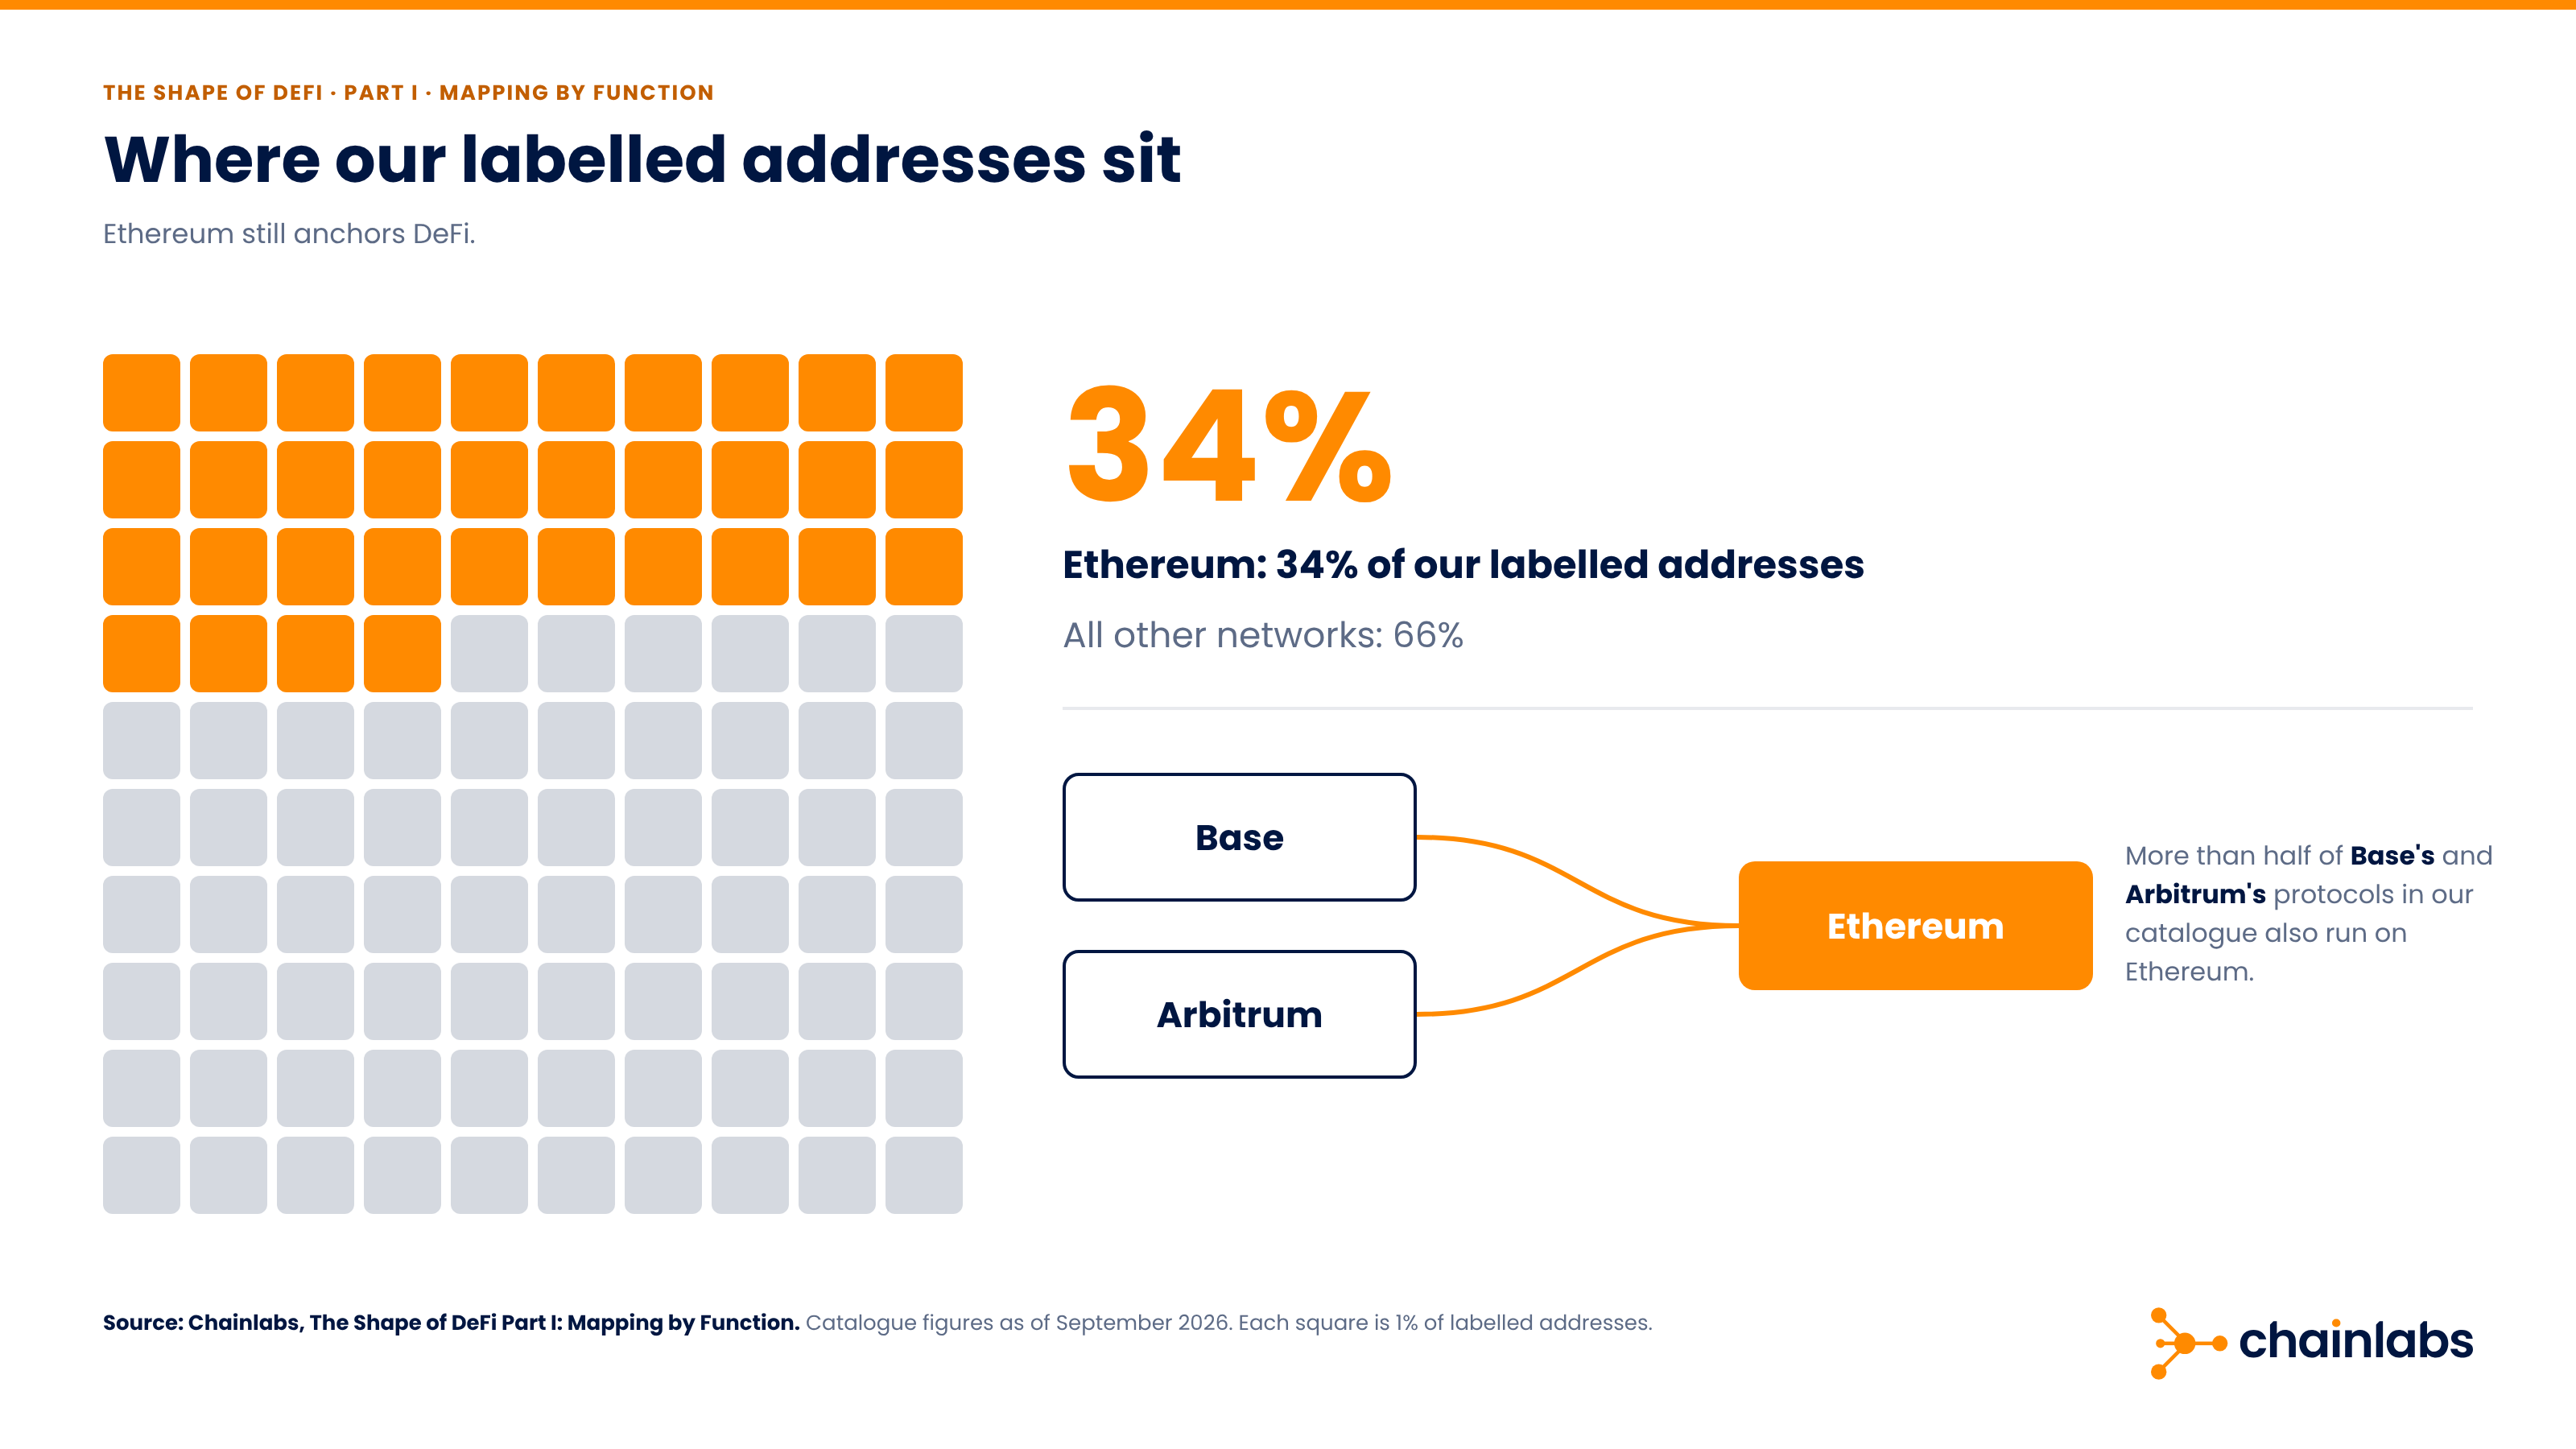
Ethereum still anchors DeFi: it holds 34% of our labelled addresses and all other networks 66%. More than half of Base's and Arbitrum's protocols in our catalogue also run on Ethereum.
On its own, it can't confirm links to exchanges, darknet markets or sanctioned entities. Our mapping provides a baseline for coverage but is not the full picture. DeFi's on-chain structure is the easiest layer to verify, making it the right place to start. The map hints at those links, but seeing them clearly requires evidence a smart contract cannot provide. In Part II, we trace one operation through Tornado Cash and across layer 2 networks, and show how it skewed the picture of what mixer users do. Part III looks at who is on the other side of the scam- and exploit-related volume that touches DeFi.
PART II OF III
One coordinated operation is behind most of the bridging by mixer recipients on Ethereum in summer 2026.
In short: One coordinated operation is behind most of the bridging by mixer recipients on Ethereum in summer 2026. Between early July and early September, 11,723 new addresses each took a single Tornado Cash withdrawal, sent everything to a layer 2 network about 48 seconds later, and the money returned to Ethereum. Counting it, 64.9% of mixer recipients bridged within 30 days and 7.2% used a DeFi protocol; set it aside and the figures are 24.8% and 15.5%. We don't know who is behind it or whether the funds are illicit, and we make no claim either way.
Between early July and early September 2026, 11,723 new addresses each received a single withdrawal from Tornado Cash, the best-known crypto mixer. About 48 seconds later (four Ethereum blocks), each sent everything to another network. On Arbitrum, 95% of those arrivals returned to Ethereum, half within 32 seconds.
Behind these addresses is a single coordinated operation, and it skews the figures below:
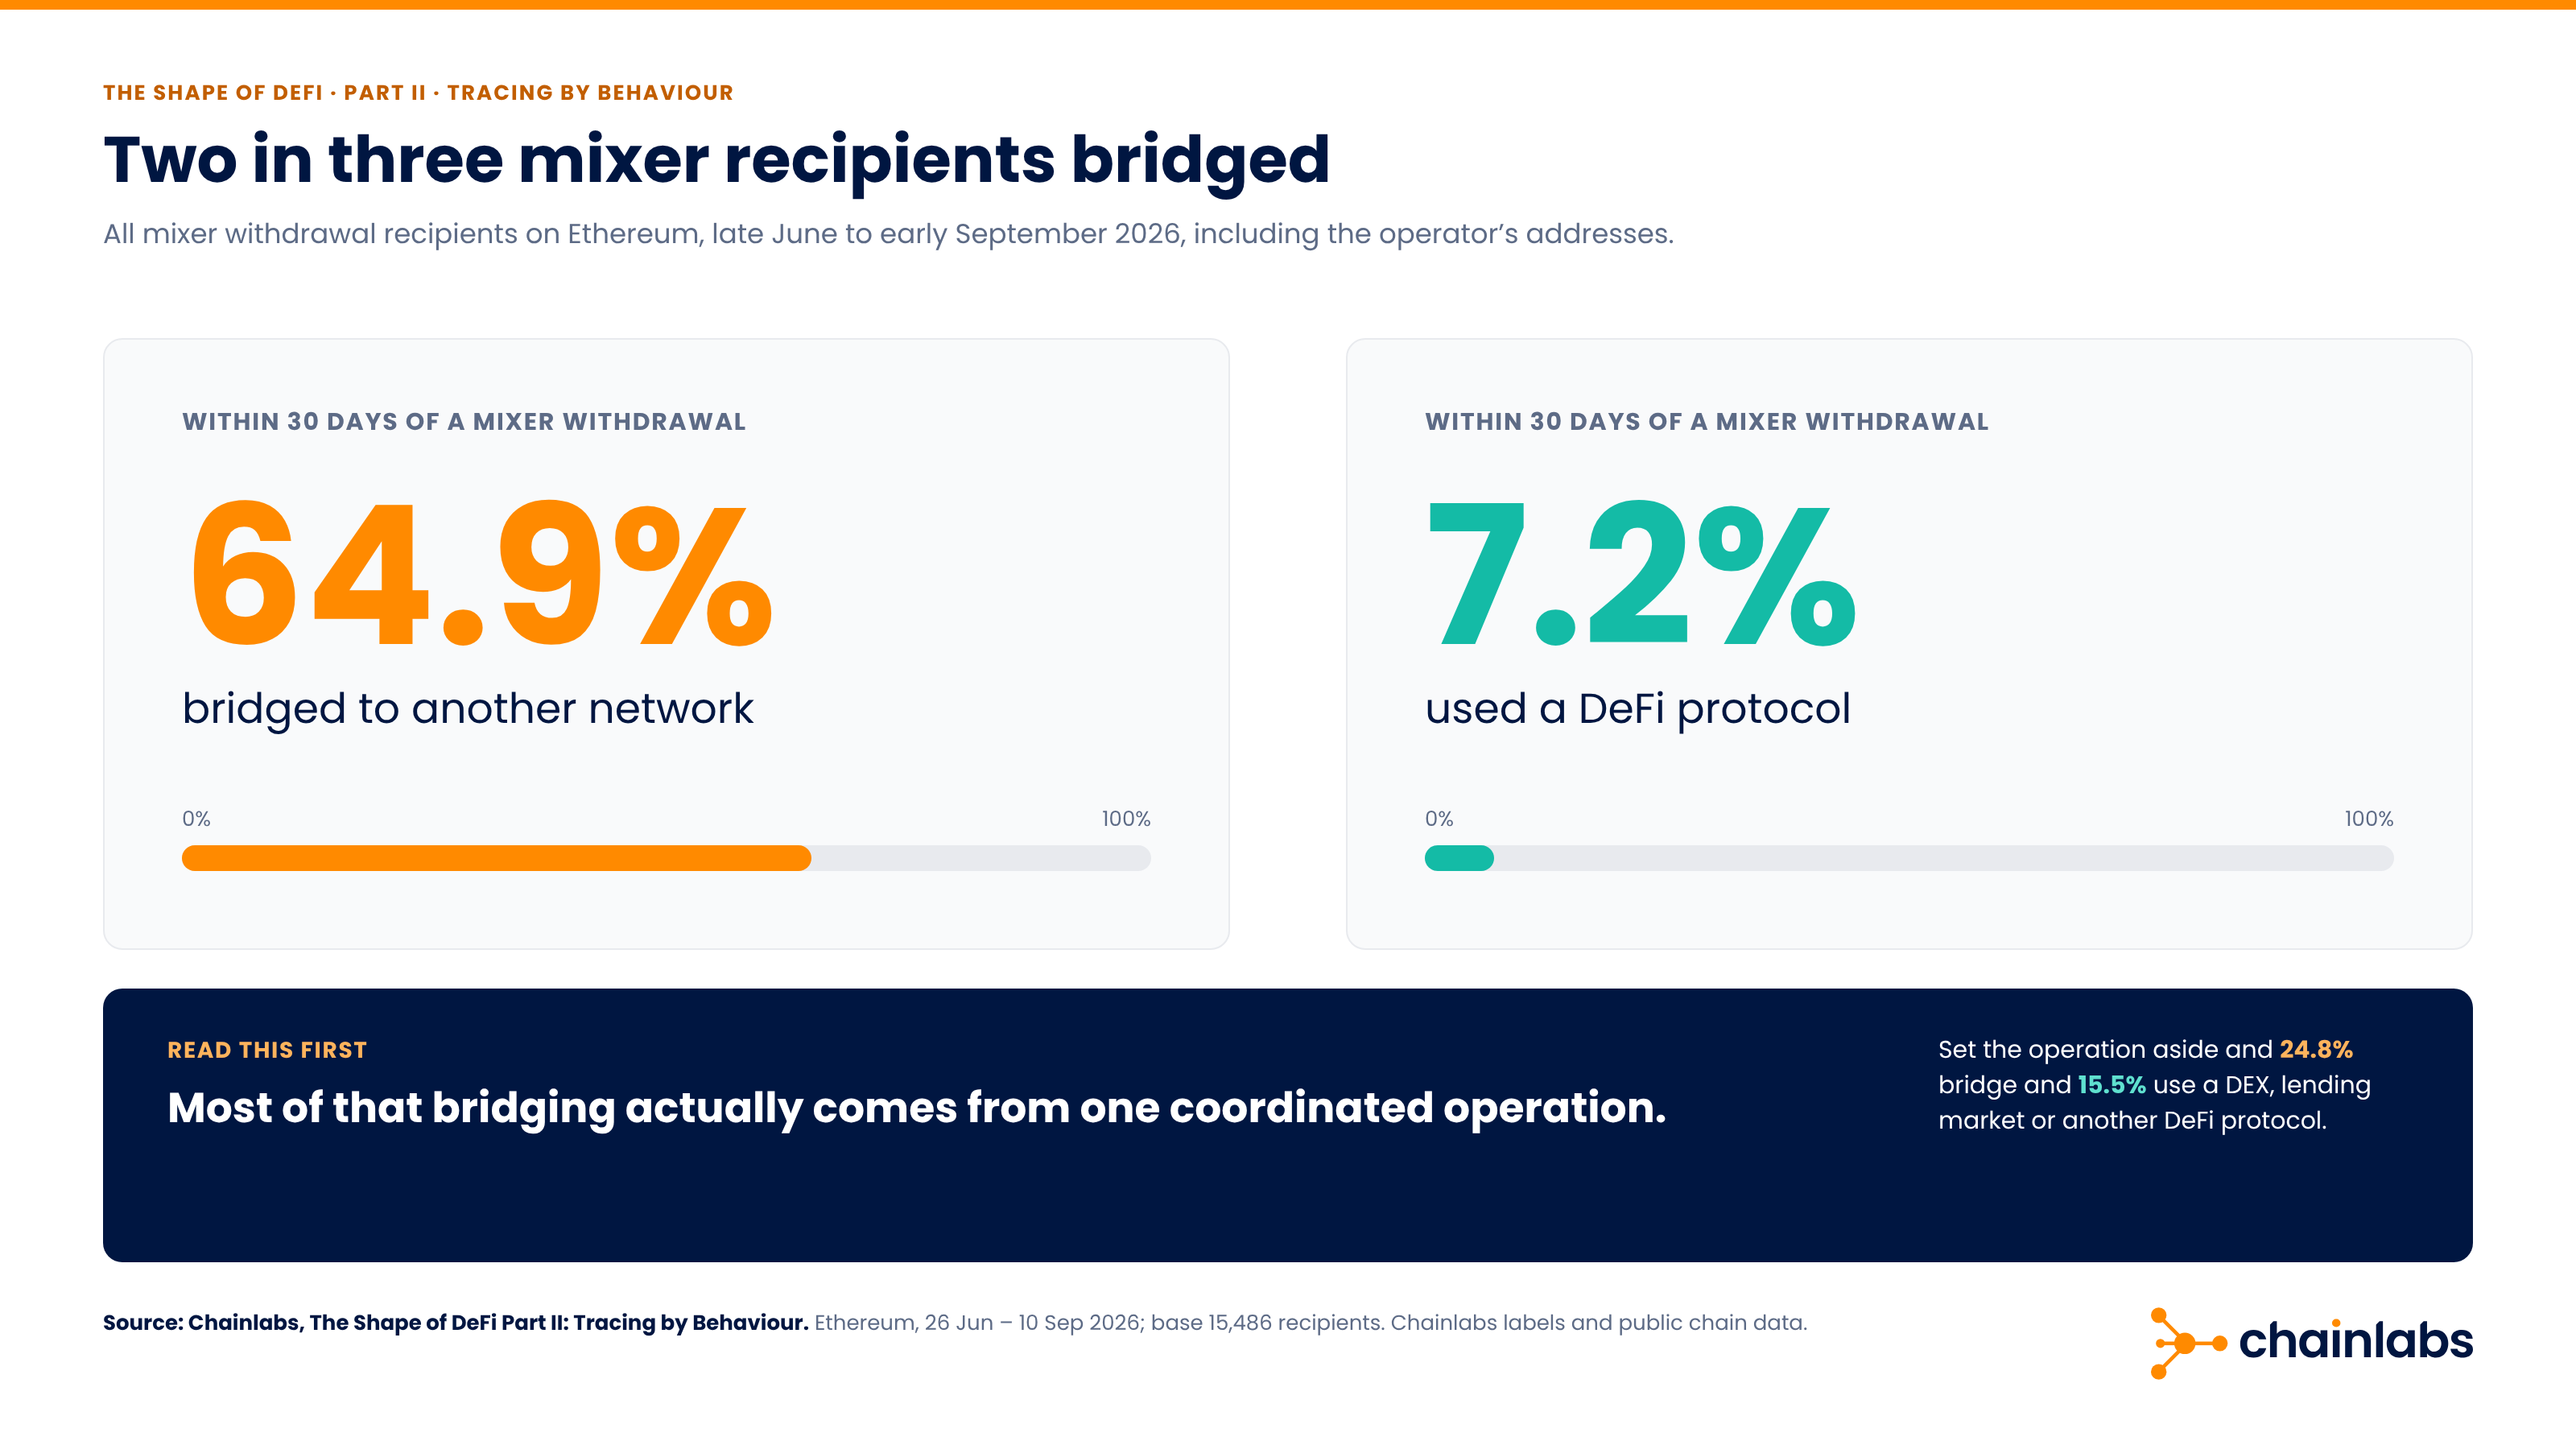
At first glance, mixer users seem to skip trading and lending and send funds straight to other networks. Most of that bridging actually comes from the coordinated operation described above.
A mixer pools funds from many users, breaking the visible link between deposit and withdrawal. Users deposit fixed amounts called notes. Layer 2 networks like Arbitrum, Optimism, and zkSync run on Ethereum and offer faster, cheaper transactions. Bridges move funds between these networks and Ethereum.
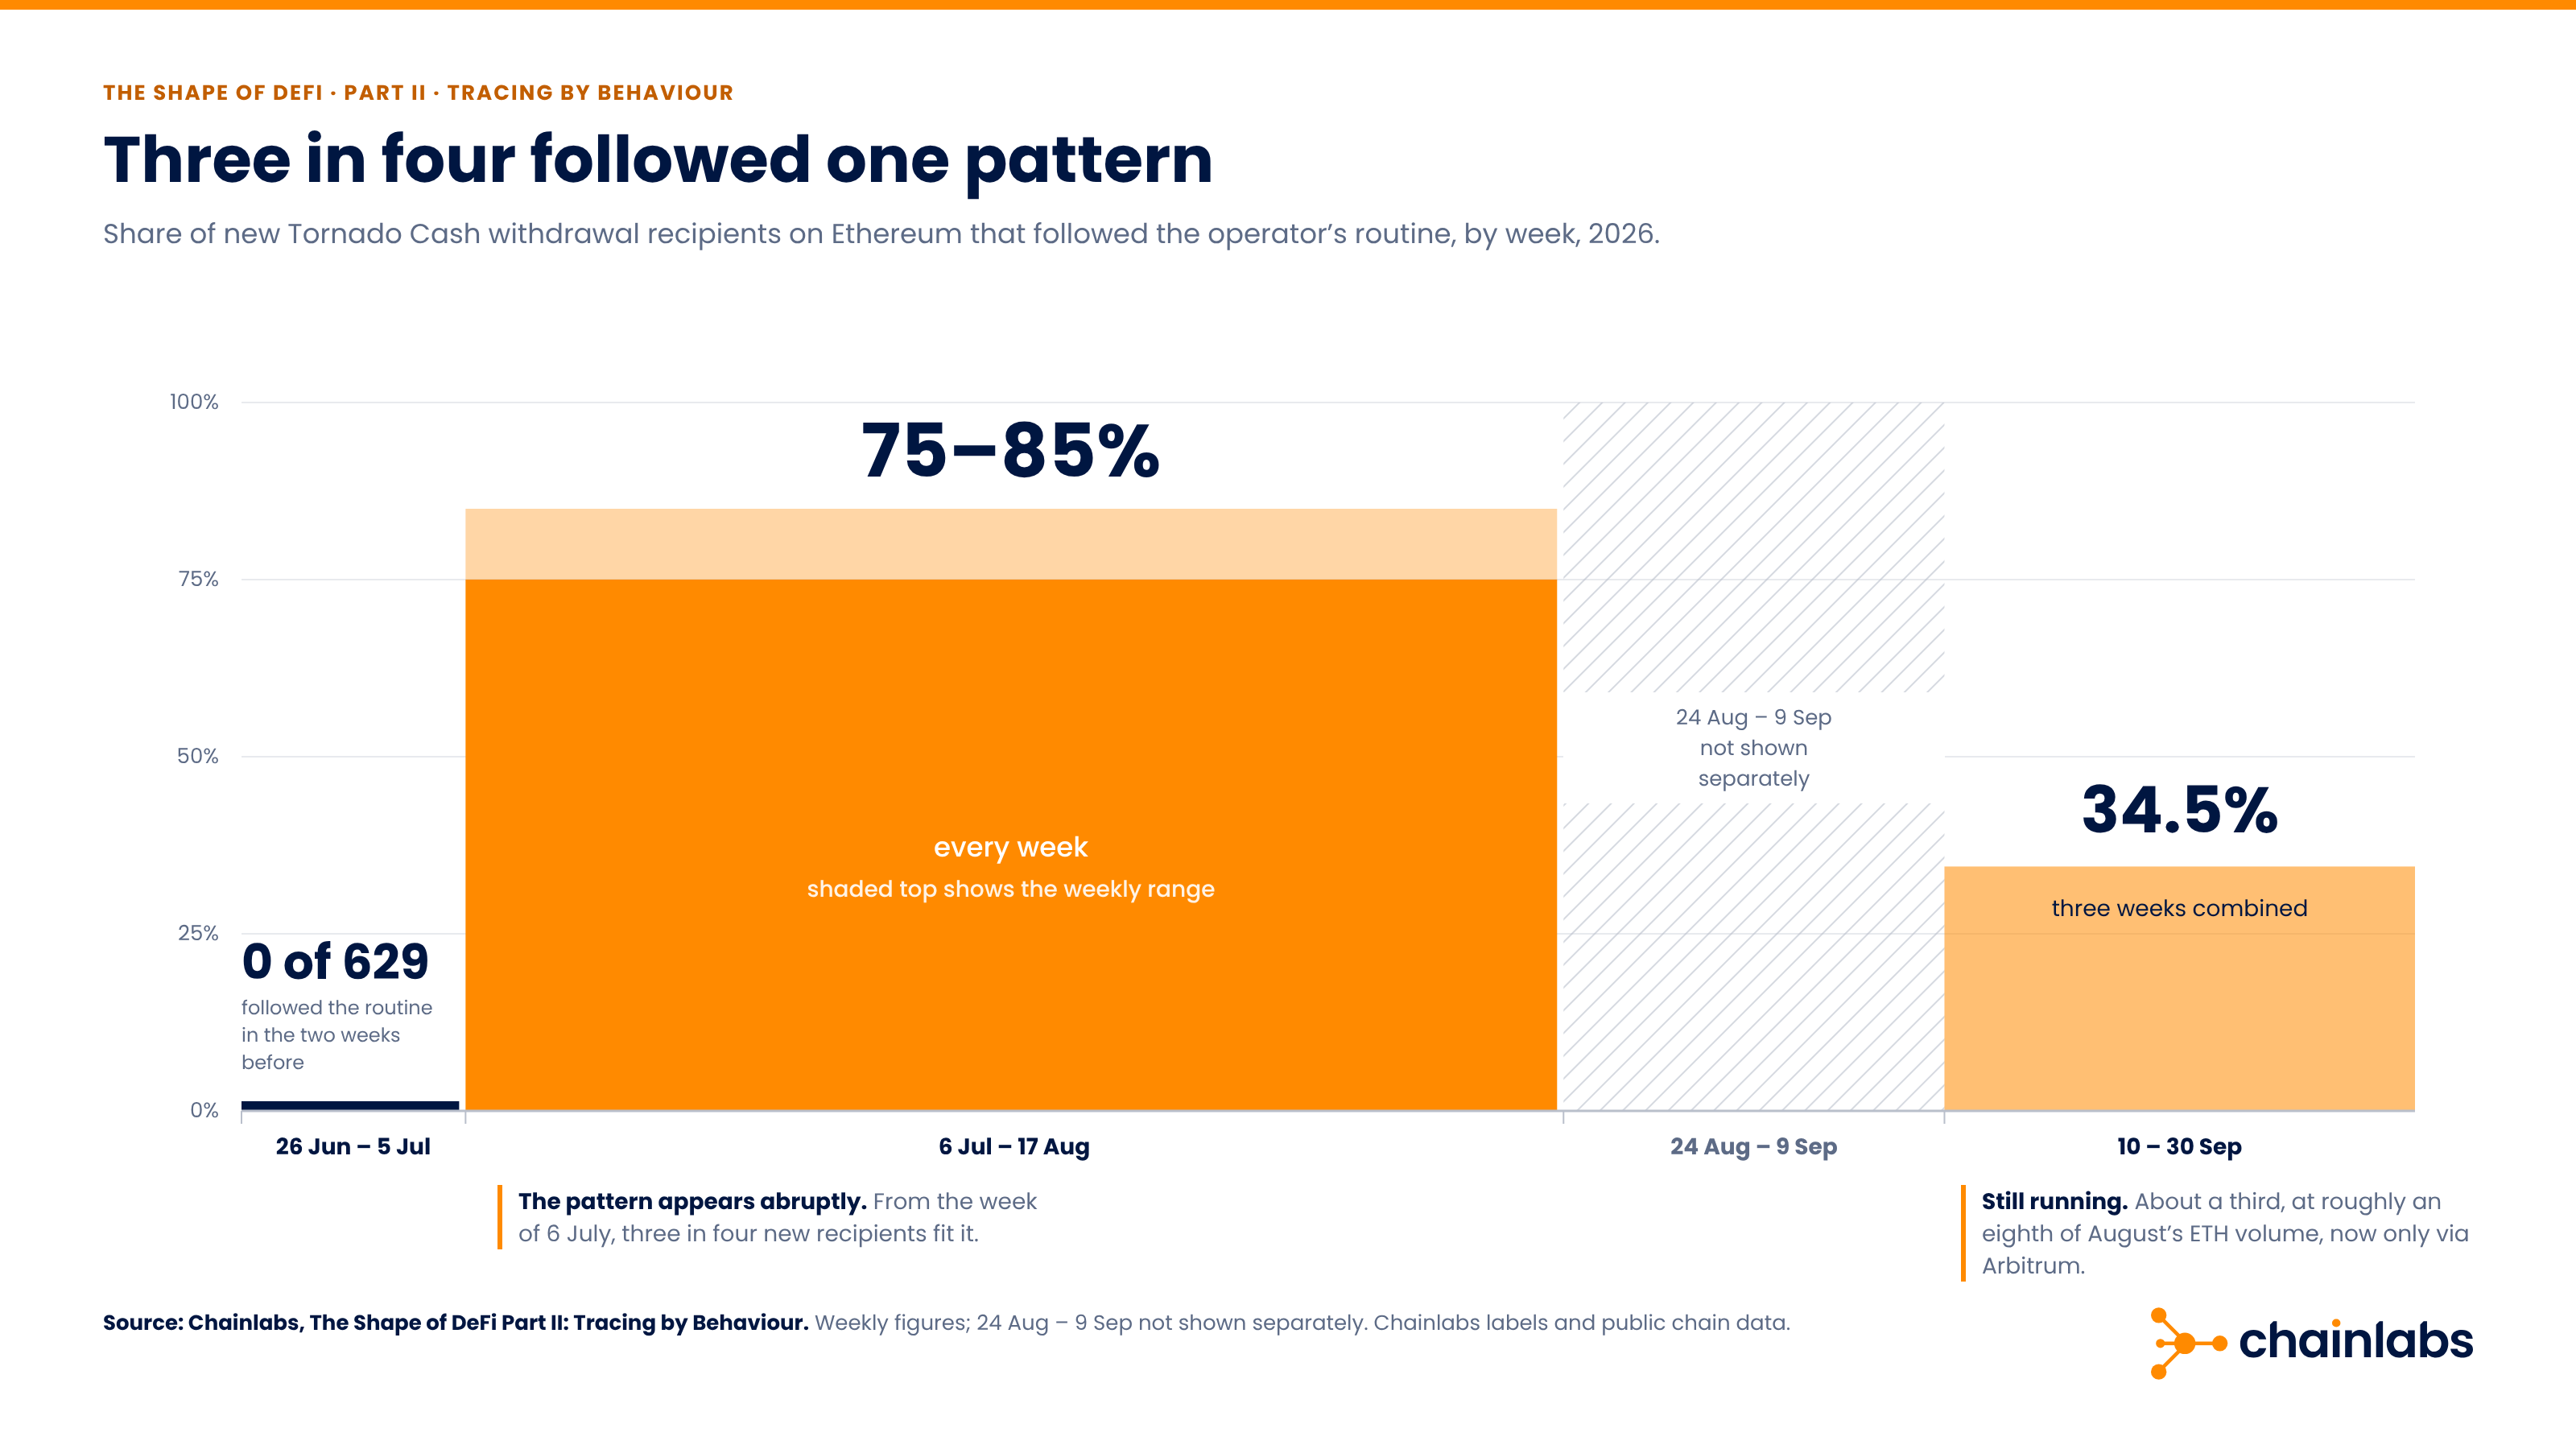
The pattern appears abruptly, in the week of 6 July. In the two weeks before, no new recipients followed this routine. From that week, three in four new recipients of Tornado Cash withdrawals on Ethereum fit this pattern.
We treat these addresses as one, so we call whoever runs them the operator. We don't know who is behind it or whether the funds are illicit, and we make no claim either way.
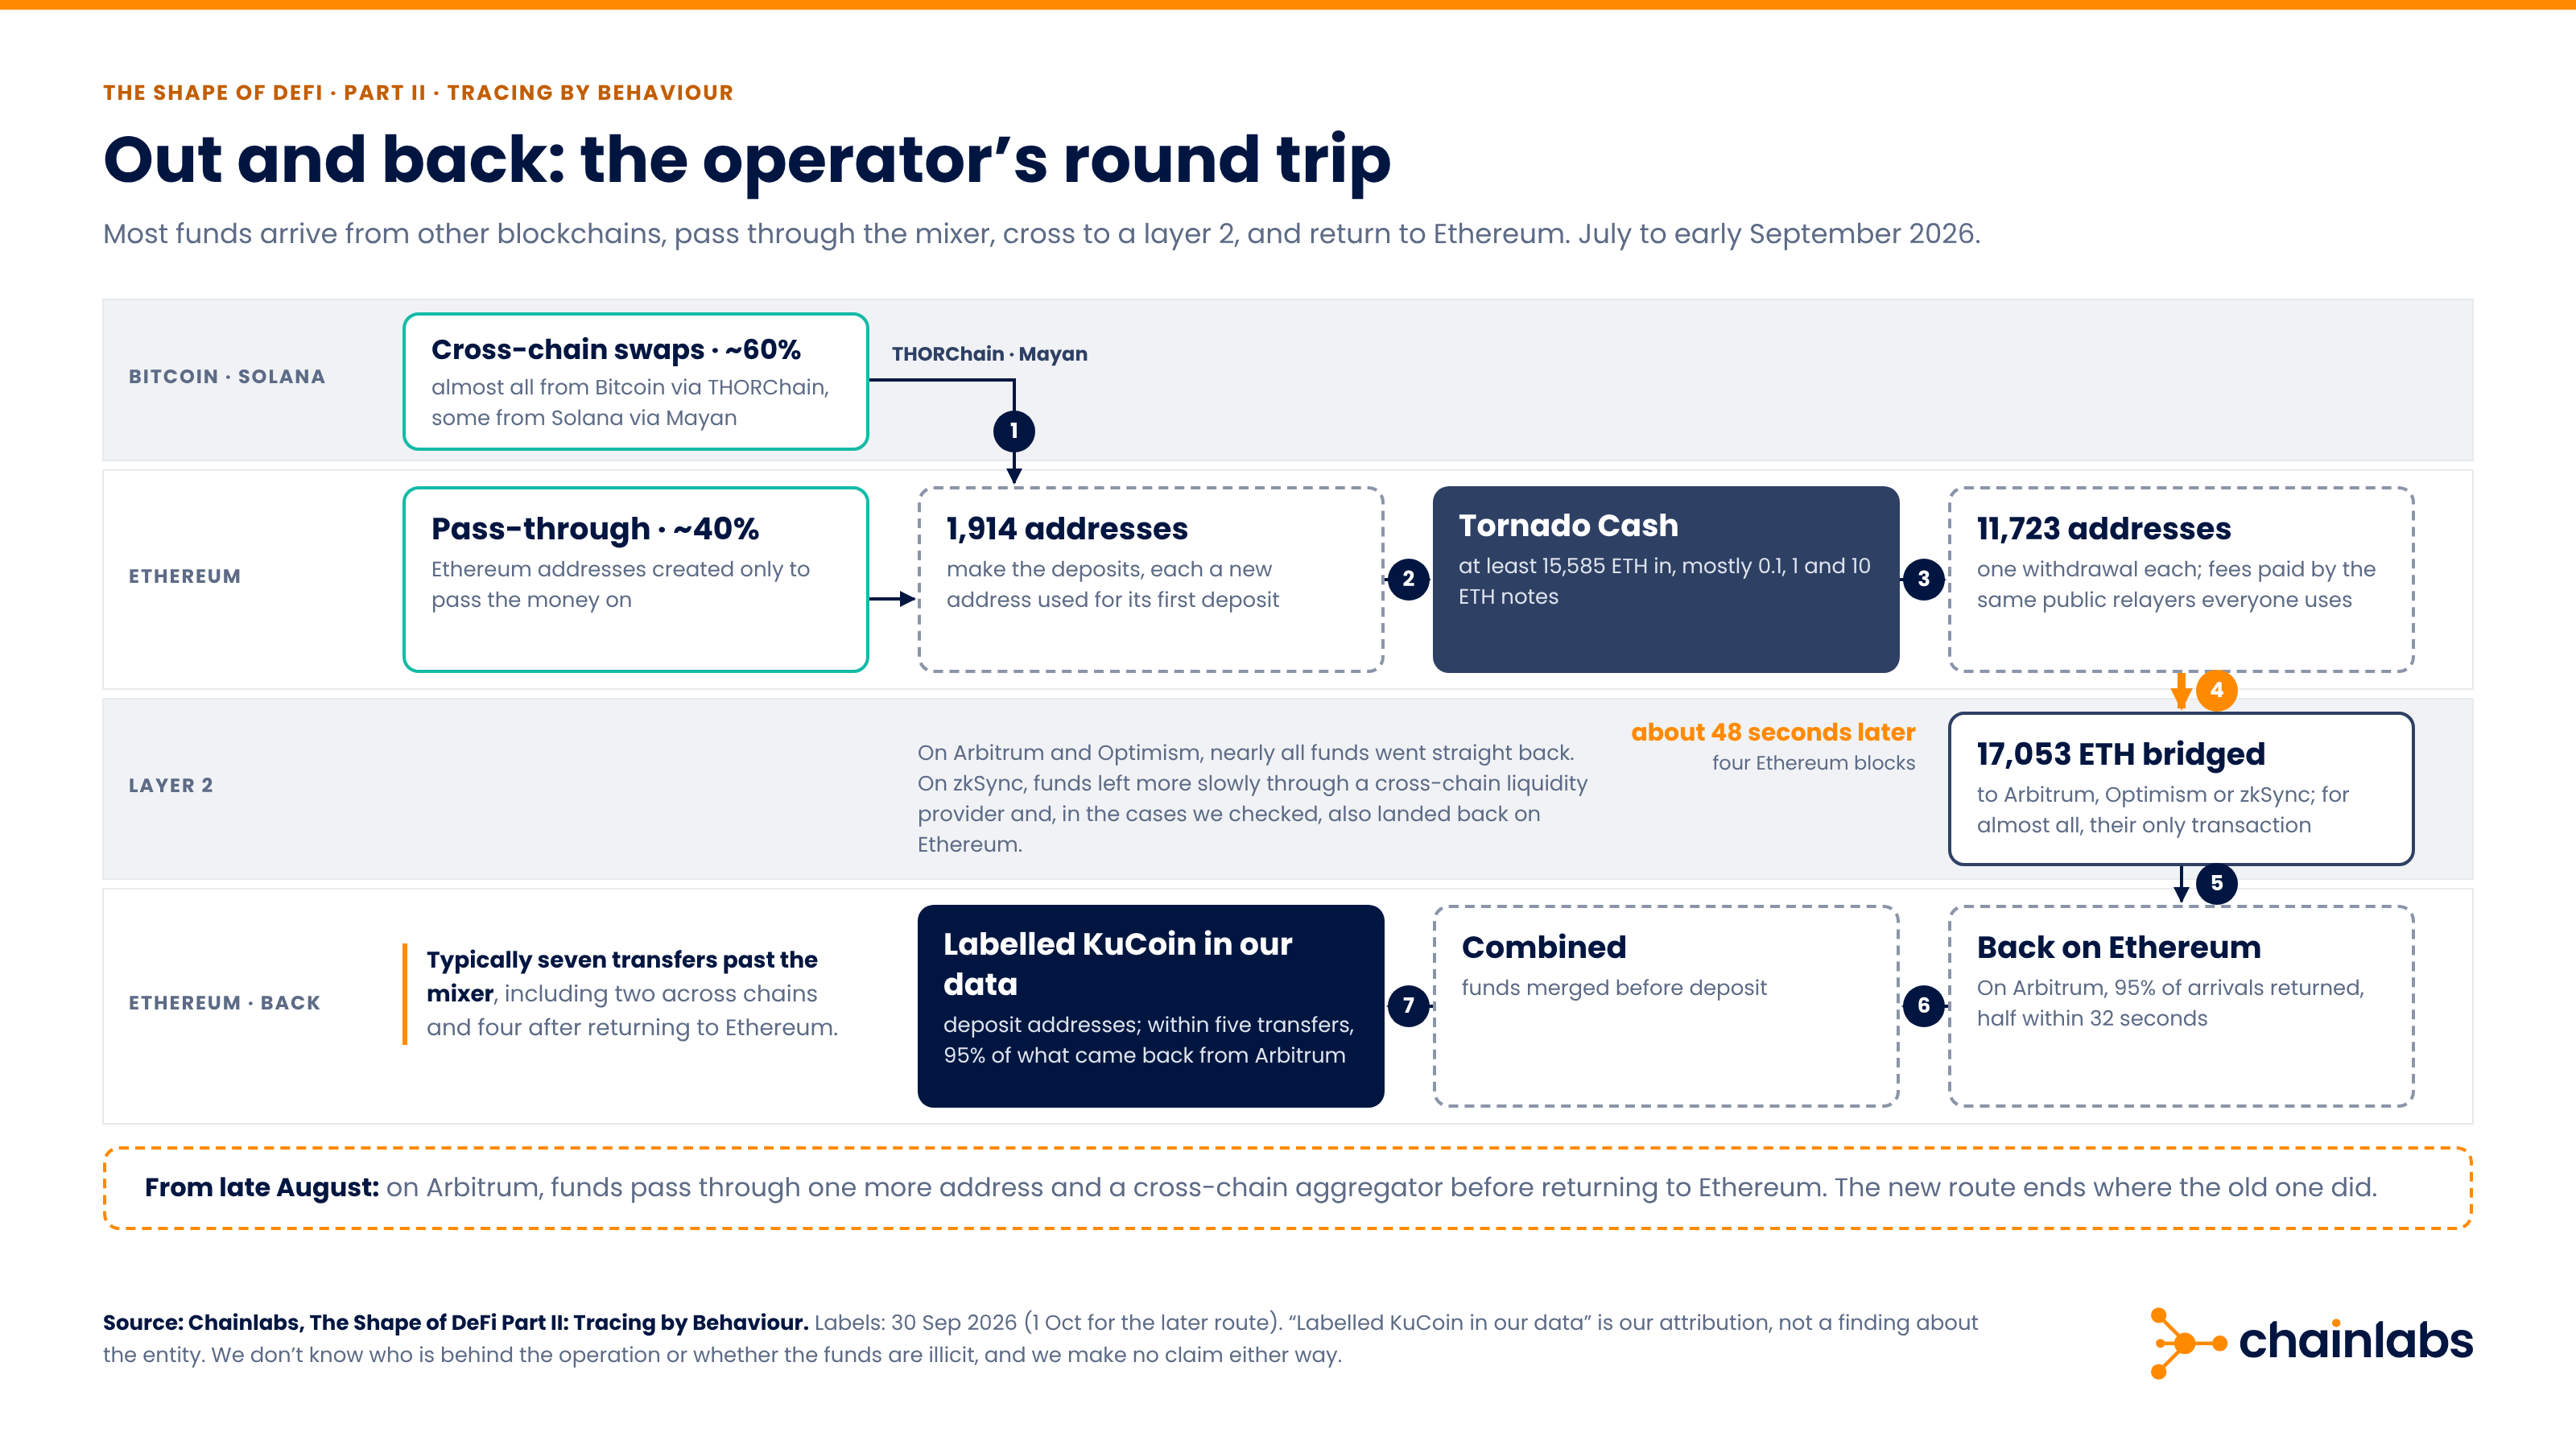
The route forms a loop: most funds arrive from other blockchains, pass through the mixer, cross to a layer 2, and return to Ethereum.
Roughly 60% of the ETH came in via cross-chain swaps, almost all from Bitcoin through THORChain and some from Solana through Mayan. The rest came from Ethereum addresses created only to pass the money on.
At least 15,585 ETH went in, mostly in 0.1, 1, and 10 ETH notes, from 1,914 addresses that made the deposits. Each was a new address used for its first deposit. The money went out to 11,723 new addresses, each with one withdrawal. The same public relayers (services that pay transaction fees on a user's behalf) that serve everyone else paid the fees.
Each address then sent everything to Arbitrum, Optimism, or zkSync, totalling 17,053 ETH. For almost all, this was their only transaction. On Arbitrum and Optimism, nearly all funds went straight back to Ethereum. On zkSync, funds left more slowly through a cross-chain liquidity provider and, in the cases we checked, also landed back on Ethereum.
Most of the money that came back from Arbitrum went to an exchange. Within five transfers, 95% reached deposit addresses our data labels as KuCoin (labels as of 30 September 2026).
By its habits. A mixer cannot hide those of an operation that repeats the same moves thousands of times. Deposits and withdrawals rise and fall together, about an hour apart. Everything points to two ends of the same operation: every deposit used the same unusual fee setting. In the smallest pool, other users hadn't deposited enough since June to cover the withdrawals, so the operator must have been funding its own. The mixer still hides which deposit paid which withdrawal.
None of this appears in a single transaction. The pattern emerges only when you view thousands of addresses across networks, with the services they touch labelled. That is the view Chainlabs' data is built to give.
"Look at any one of these transactions and nothing stands out. Put more than 11,000 addresses side by side, each bridging within about a minute of its withdrawal, and you are looking at one operation," says Martín Jofré, Lead Analyst at Chainlabs.
Yes. Through September, about a third of addresses receiving Tornado Cash withdrawals on Ethereum still followed the same pattern, at roughly an eighth of August's ETH volume, now only via Arbitrum.
In late August, the route changed. On Arbitrum, funds pass through one more address and a cross-chain aggregator before returning to Ethereum. From mid-September, a single address took a 1% cut on nearly every transfer.
The new route ends where the old one did: back on Ethereum, combined, and into deposit addresses labelled KuCoin in our data (labels as of 1 October 2026), many of them the same addresses as in August.
Set that operation aside, and about a quarter of recipients bridge (24.8%), while about one in six use a DEX, lending market, or another DeFi protocol within 30 days (15.5%).
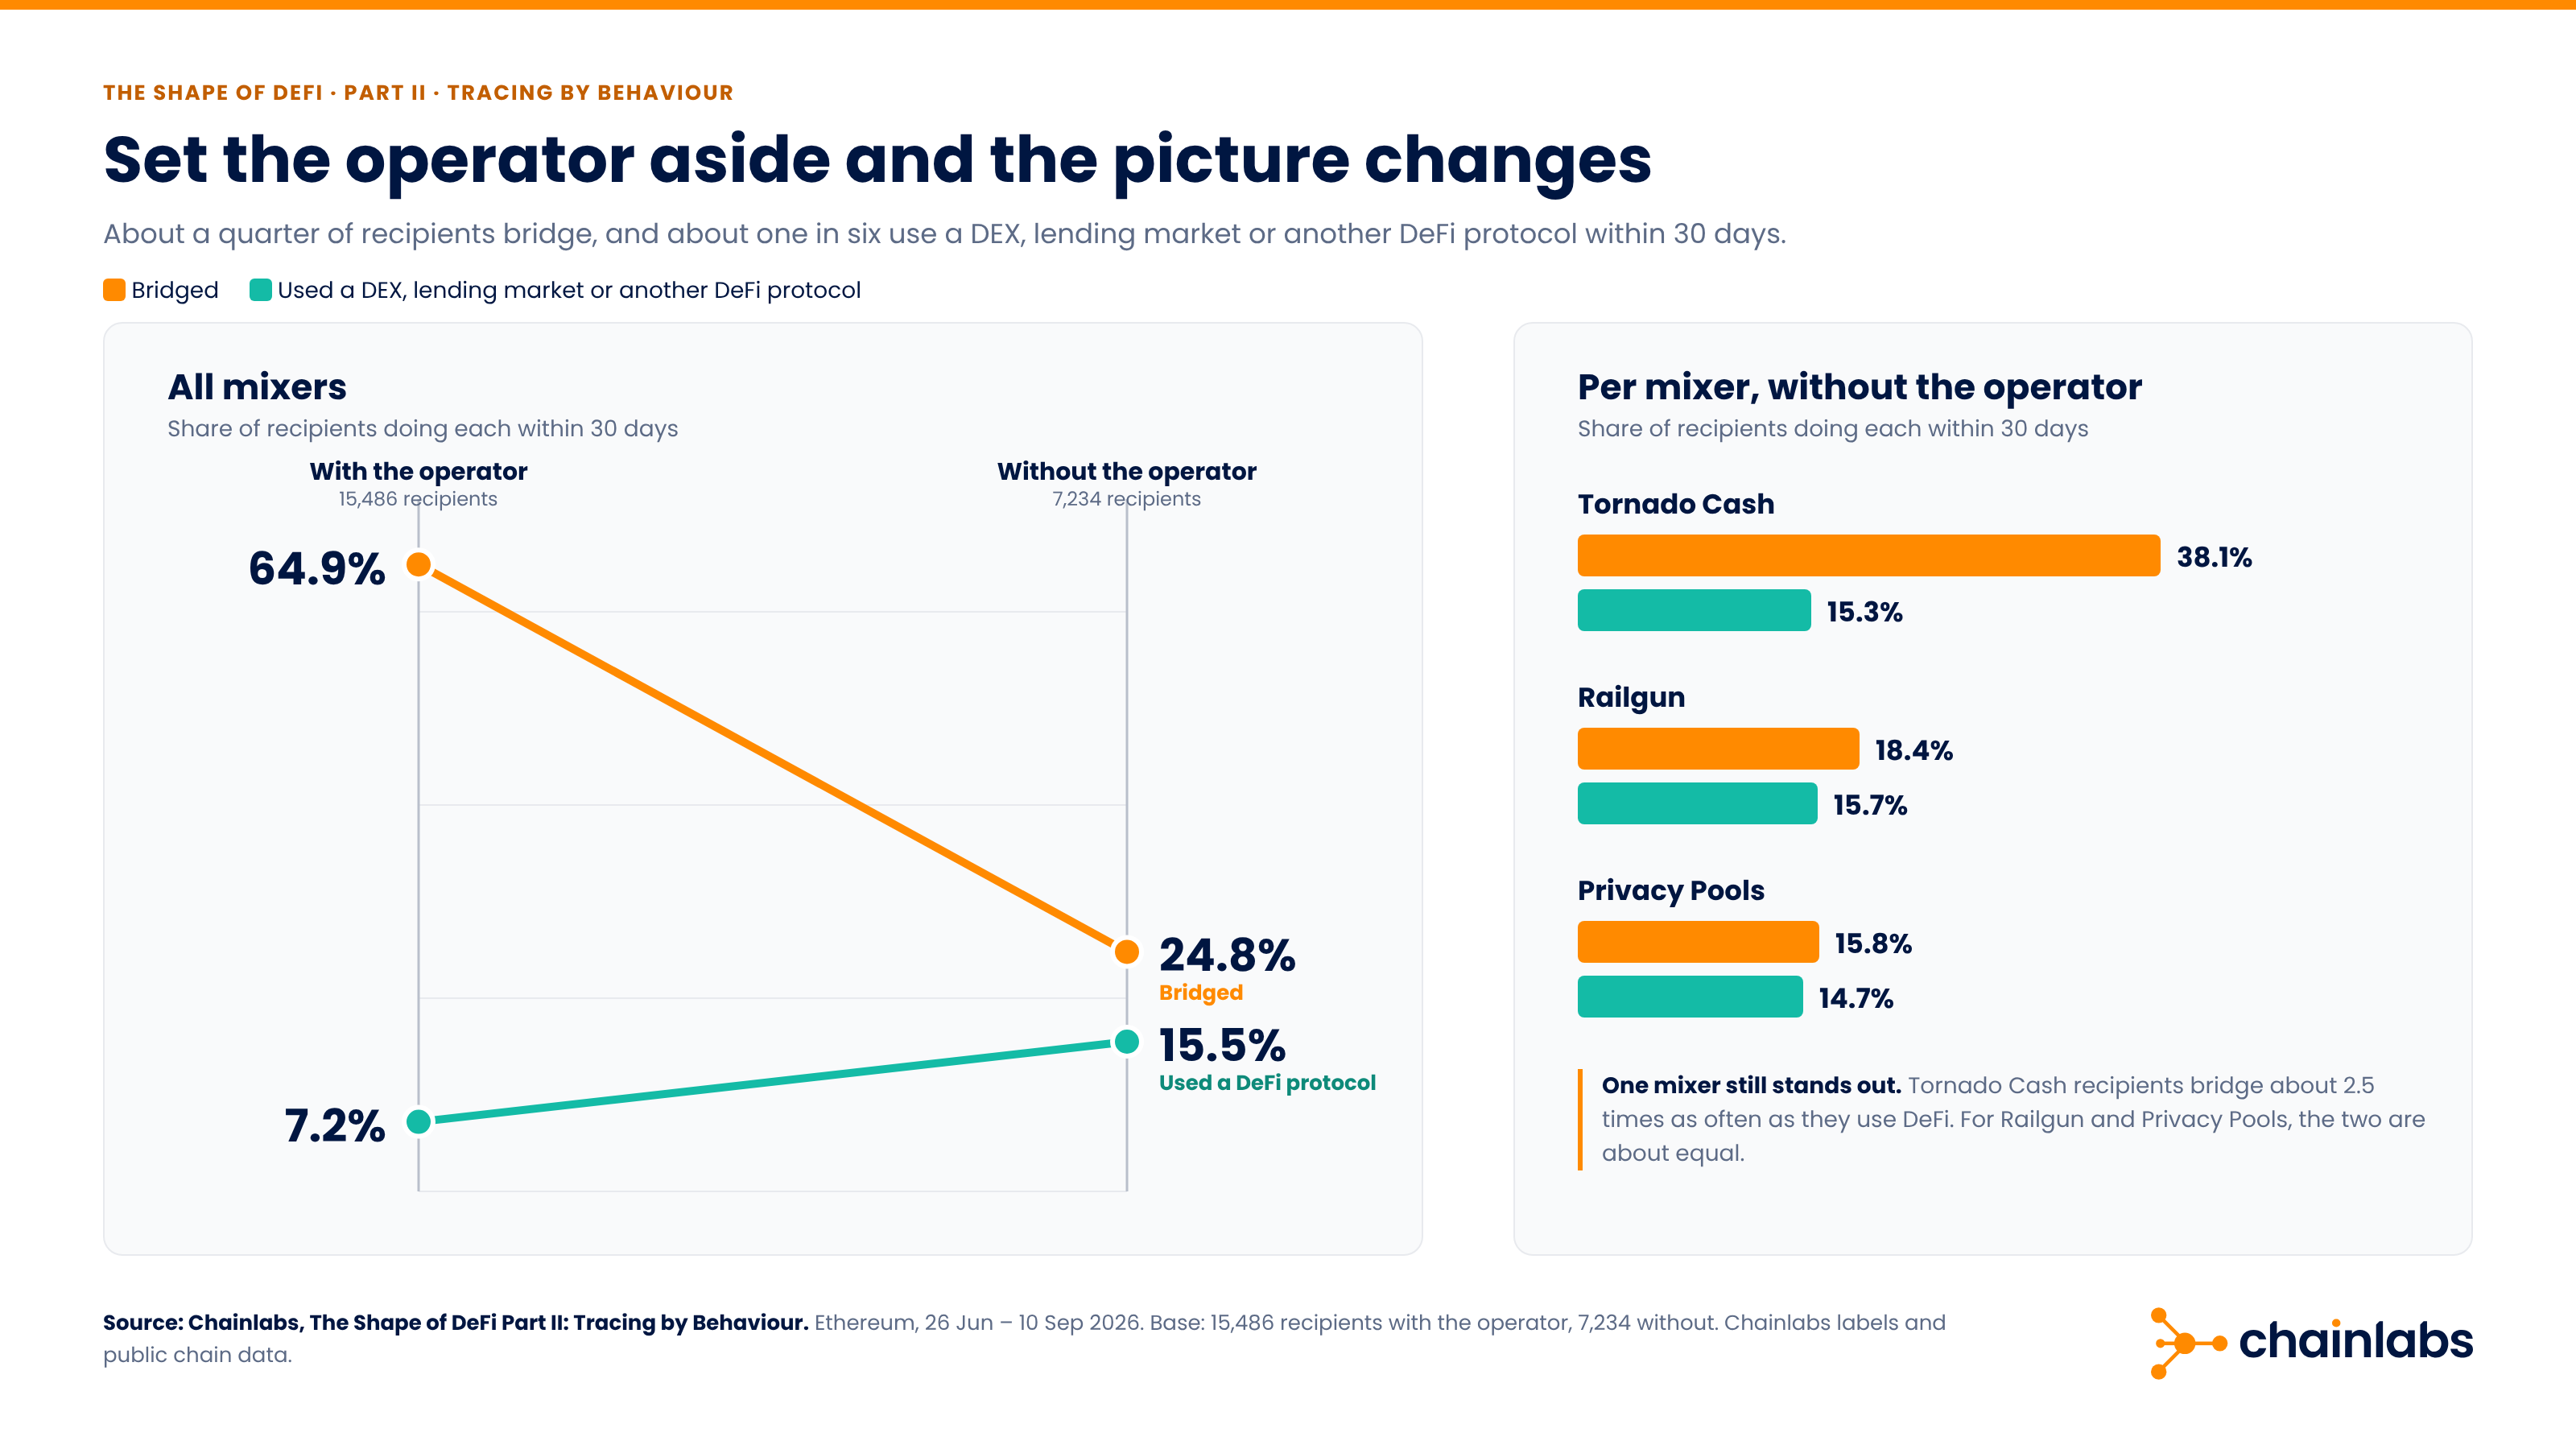
One mixer still stands out. Even without that operation, recipients of Tornado Cash withdrawals bridge about 2.5 times as often as they use a DEX, lending market, or another DeFi protocol. For Railgun and Privacy Pools, bridging and DeFi use are about equal.
Because one busy operator can look like a market-wide trend until you break the figure down. Part I showed that ranking DeFi by assets held misses what protocols actually do. Here in Part II, the same problem shows up inside a single statistic.
For anyone reading blockchain data, whether an analyst, a compliance team, or a journalist, the lesson is to identify the actor behind a pattern before drawing conclusions about the market.
PART III OF III
Scams and exploits both use DeFi on Ethereum, but in different ways.
In short: Scams and exploits both use DeFi on Ethereum, but in different ways. Between 1 January 2024 and 25 August 2026, Chainlabs data shows about $74M of stablecoin volume between scam-labelled addresses and DeFi contracts, almost two-thirds of it on decentralised exchanges (DEXs) and a quarter on bridges. Just over half of that volume resolves to named entities, and those entities typically use one venue each. Exploit-labelled addresses show about $161M of stablecoin volume plus 12,985 ETH from 166 addresses, more than two-fifths of it from one incident, the Cetus hack, and exploit entities touch about twice as many protocols each. Close to half of the scam volume sits under catch-all labels that cannot be tied to a single actor. All figures count both directions and cover one direct hop on Ethereum.
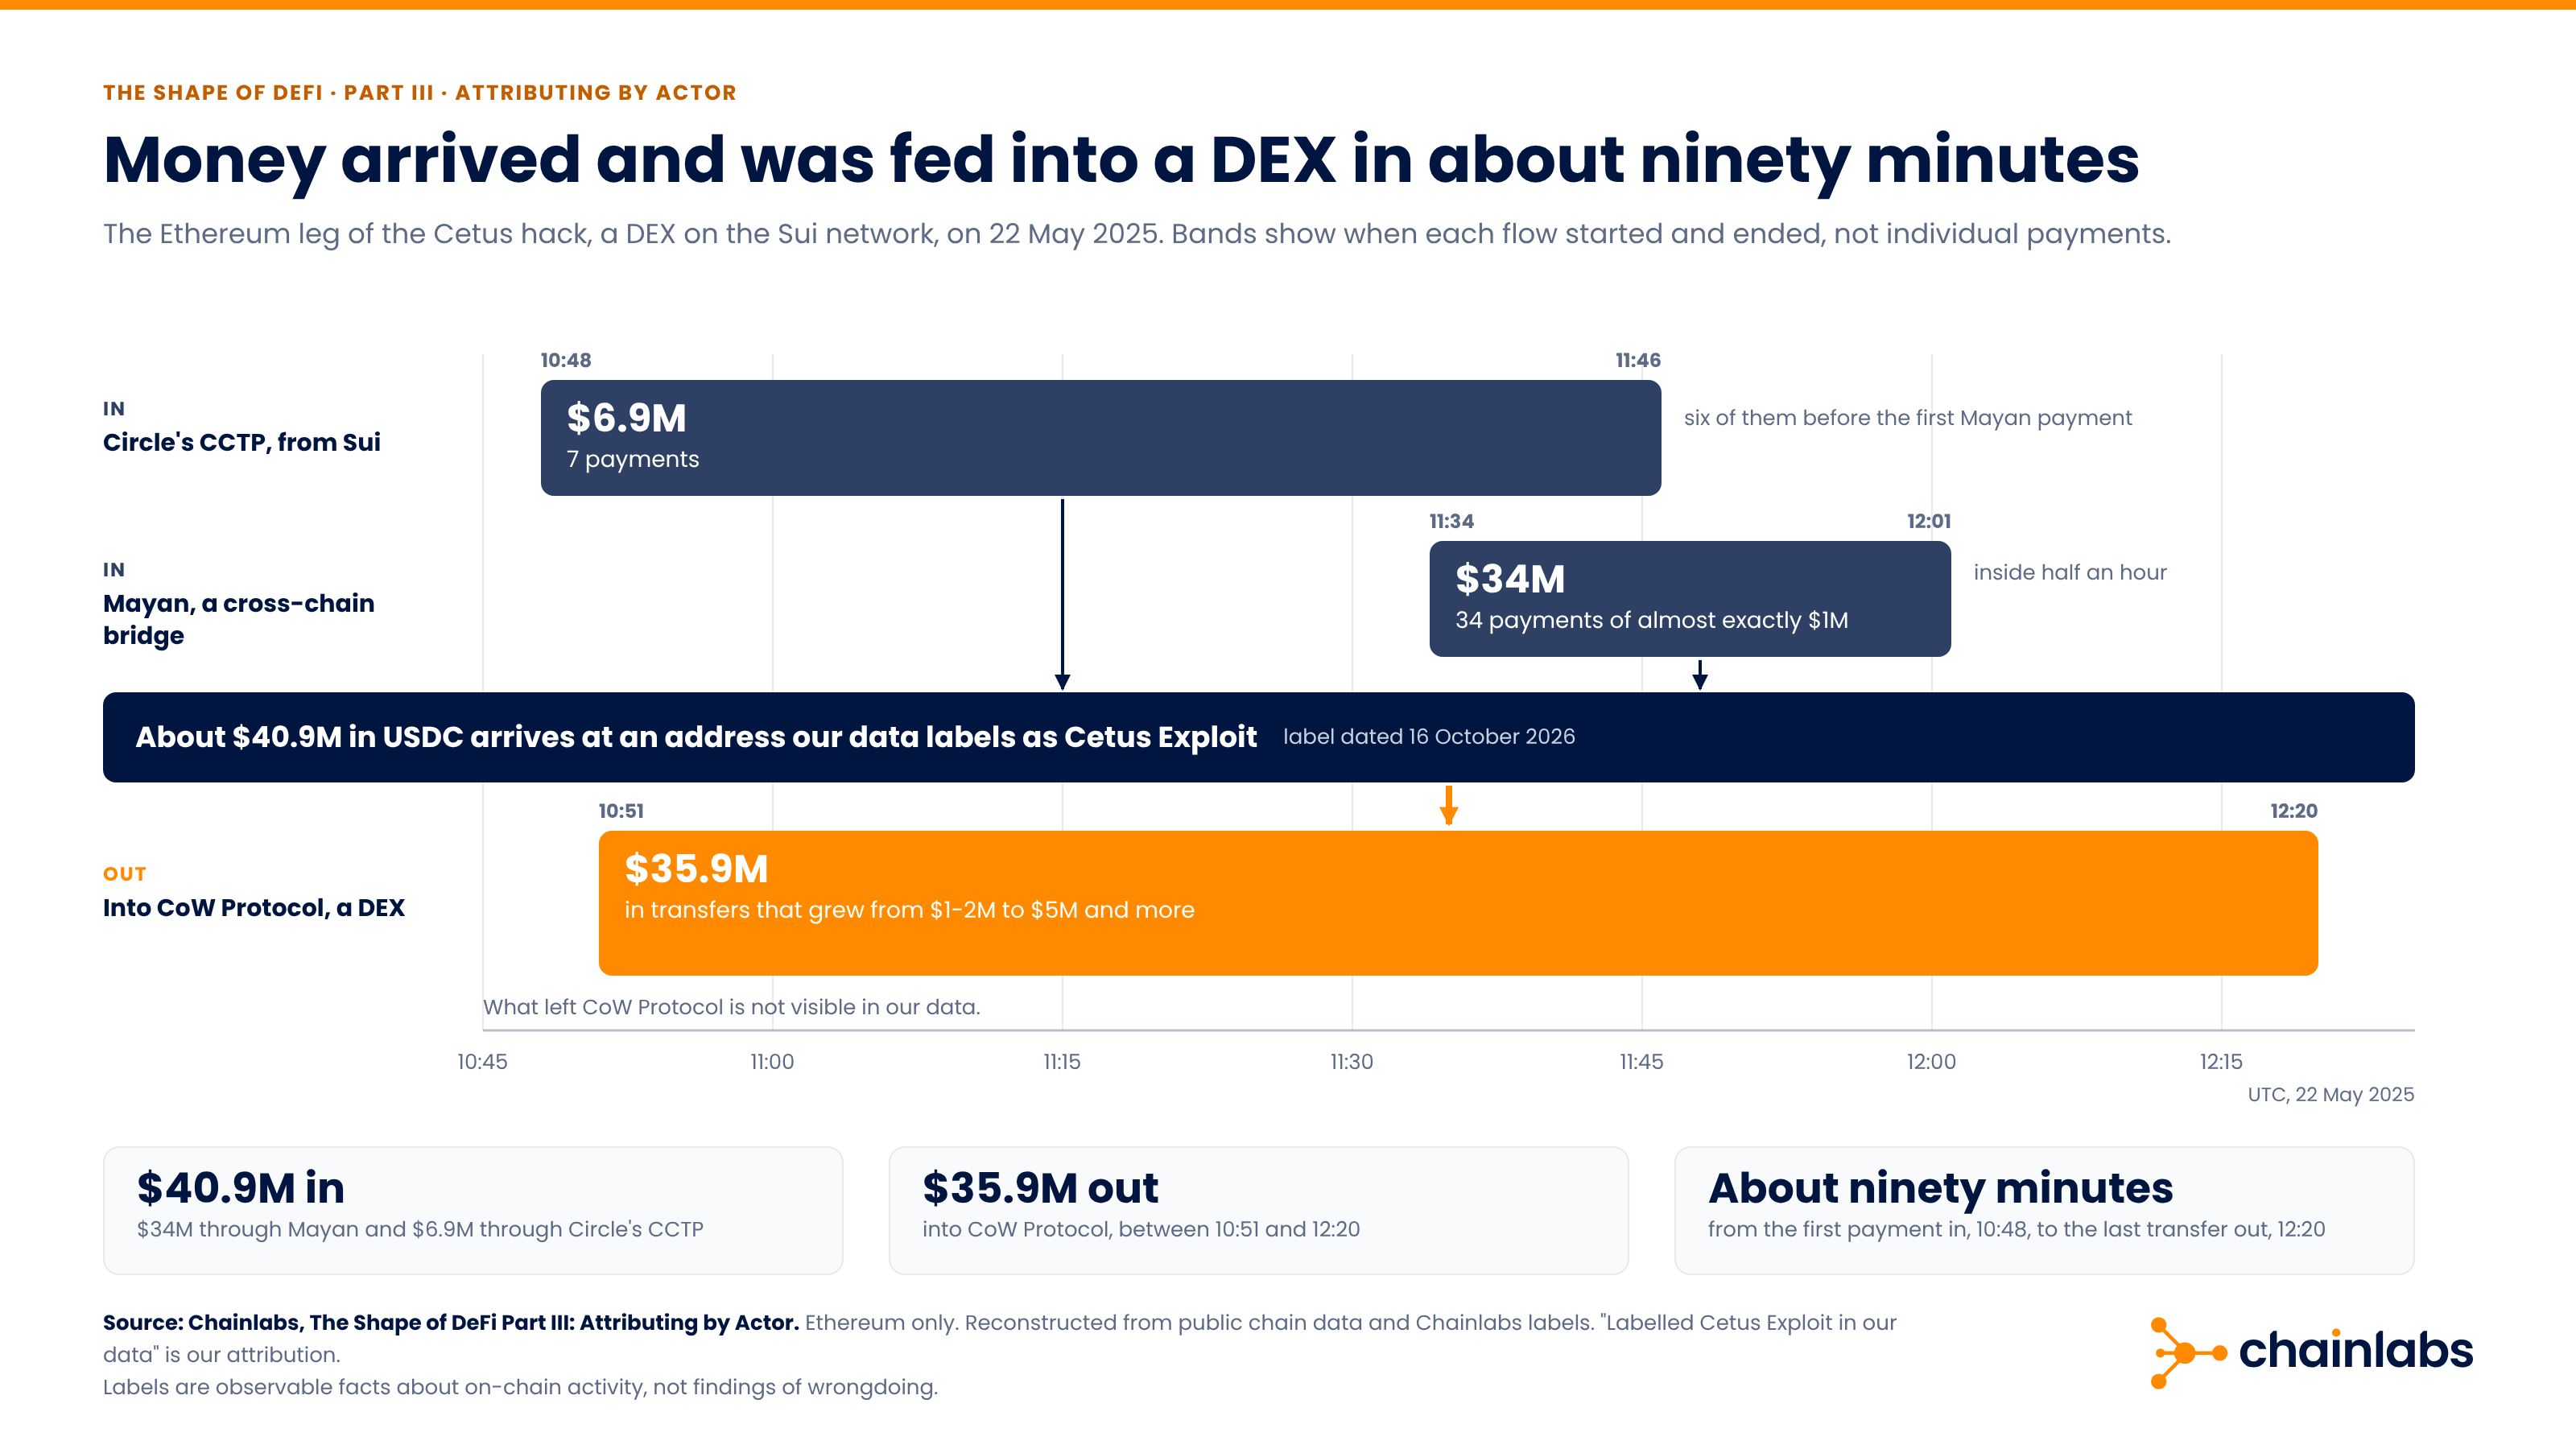
On 22 May 2025, Cetus, a DEX on the Sui network, was hacked. That day, $40.9M arrived on Ethereum, $34M of it through a cross-chain bridge in thirty-four payments of almost exactly a million dollars, and $35.9M was fed into a single DEX. The whole sequence took about ninety minutes.
Over the previous year, six Ethereum addresses later listed in an SEC complaint had run the same two steps in the opposite order: ETH sold for USDT on a DEX, then about $12.8M sent out through a bridge to TRON.
The two cases sit at either end of this study, which crossed our scam and exploit labels with our DeFi labels and measured every direct transfer between them on Ethereum. Scam-related volume runs mostly through DEXs and bridges, one venue at a time. Exploit-related volume is larger, dominated by a single incident, and spread across more protocols.
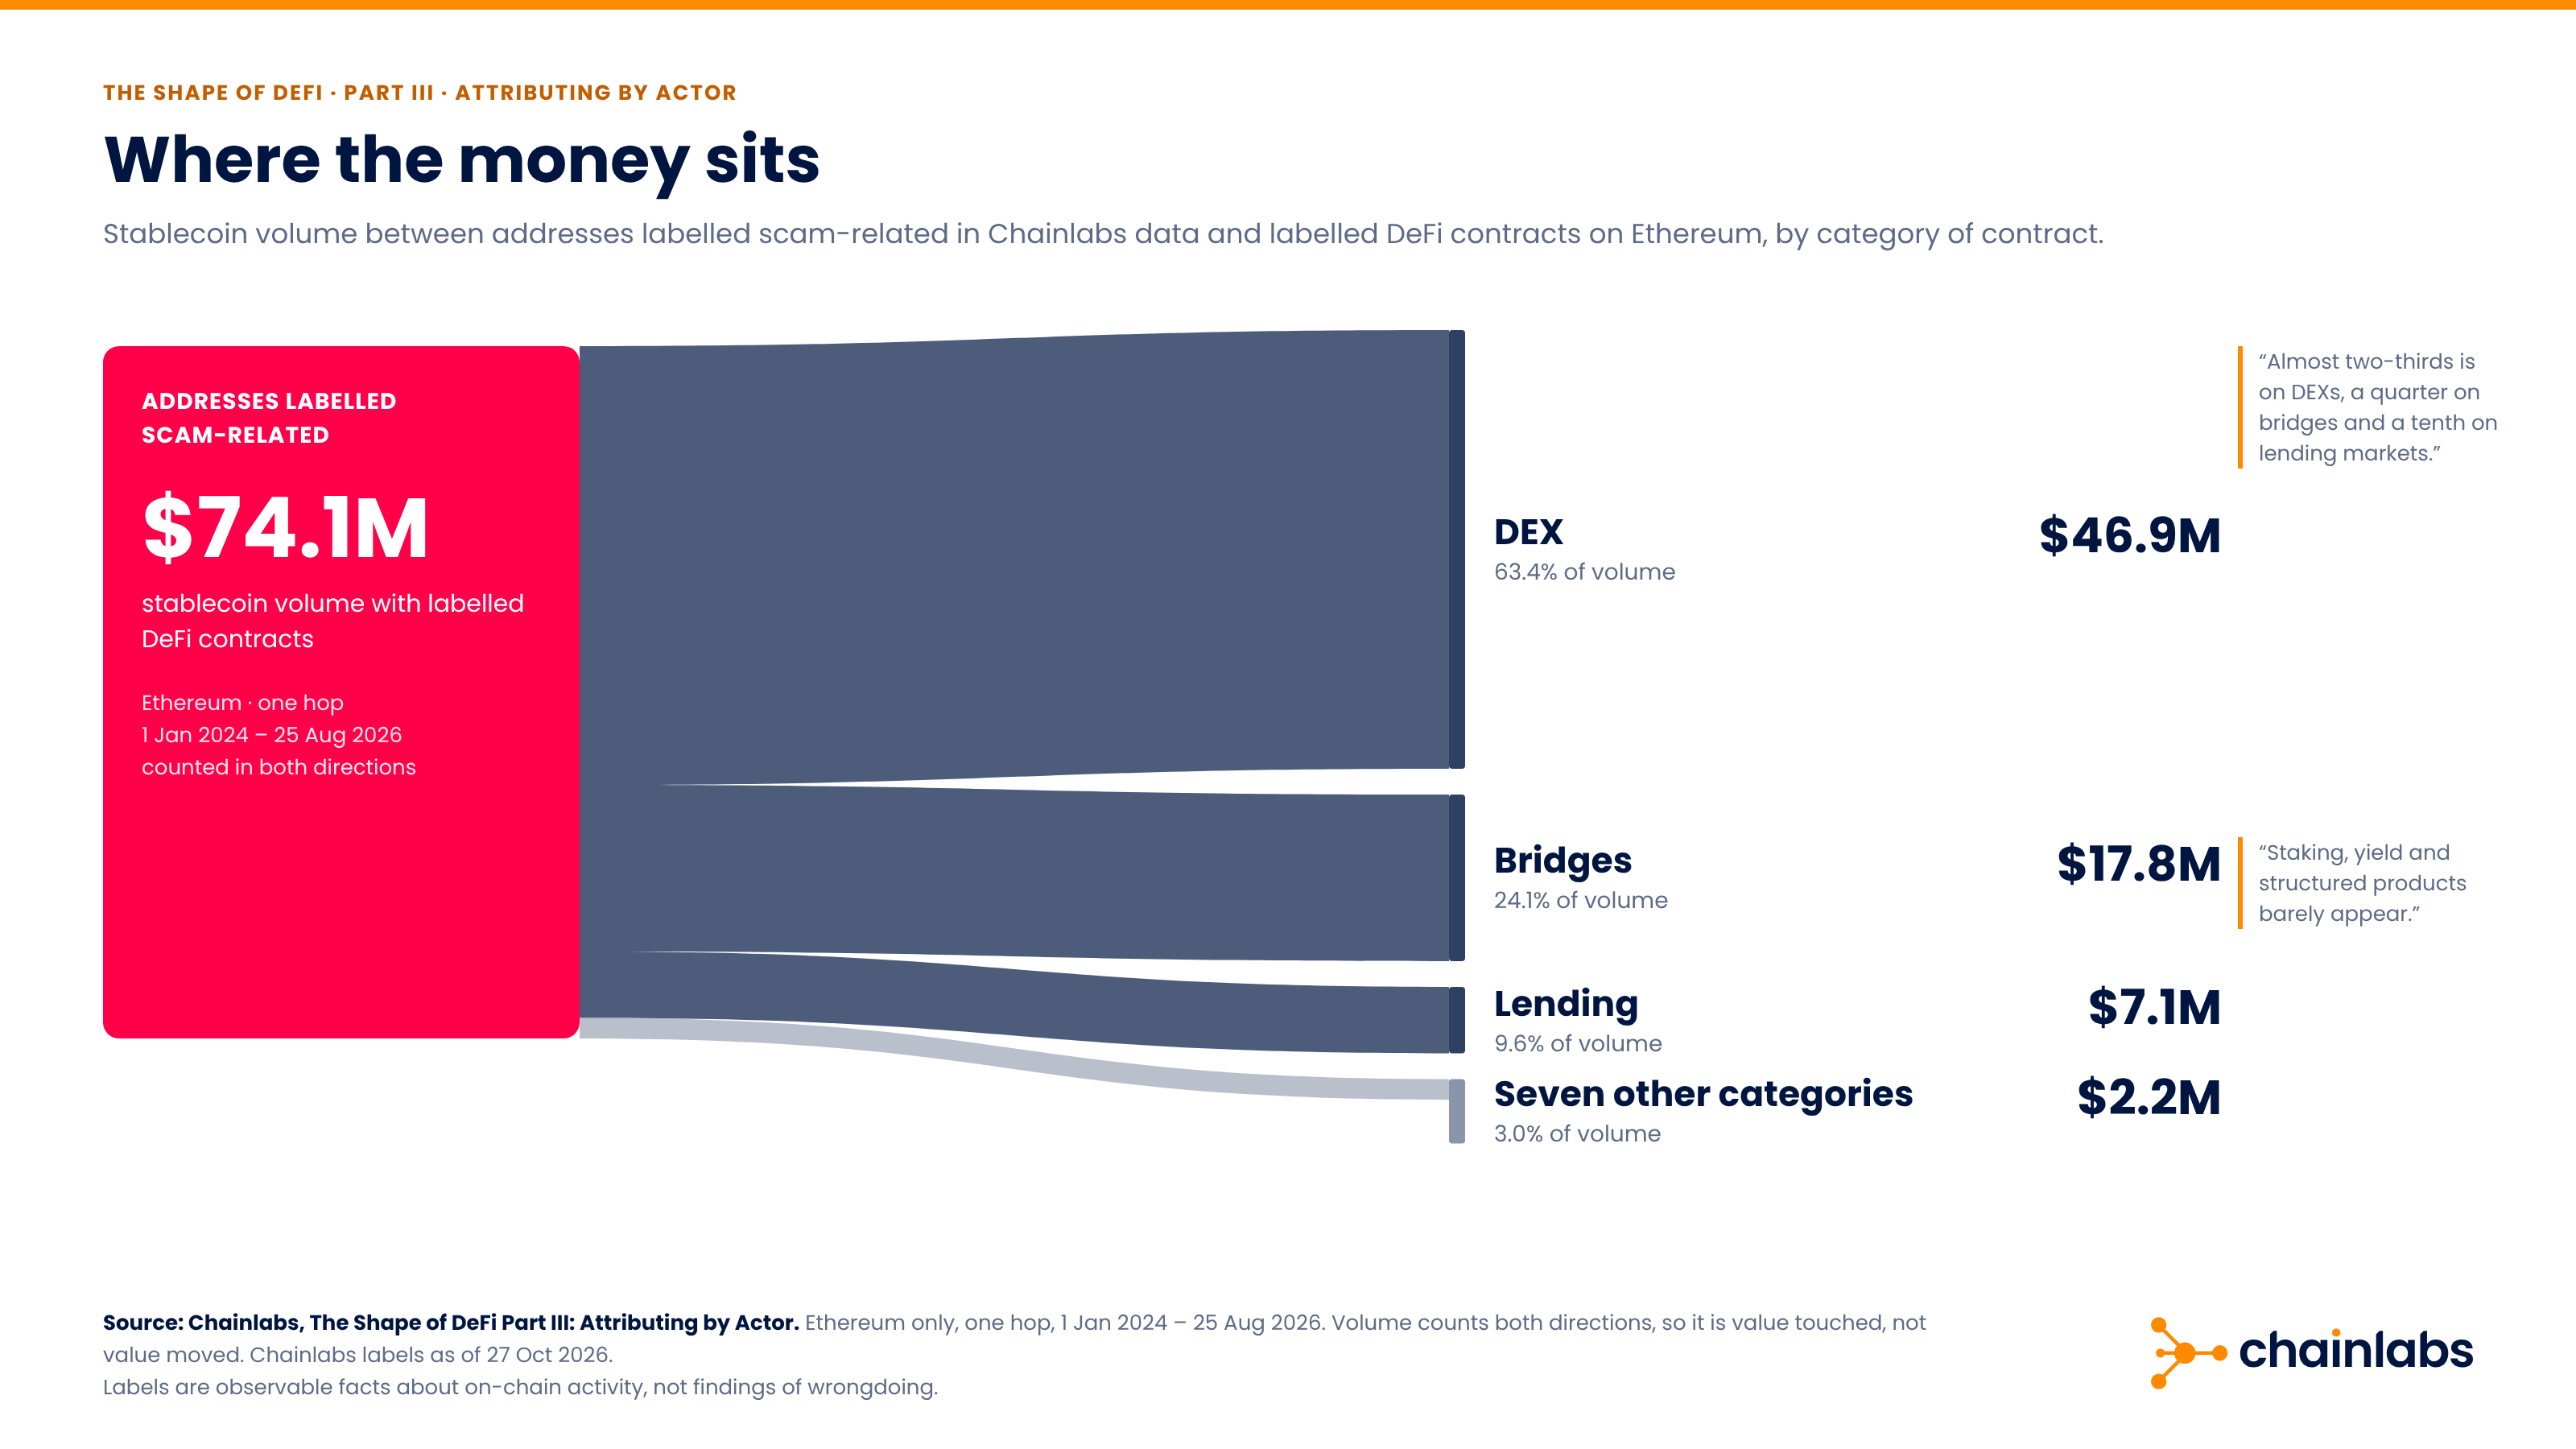
Most of the volume passes through venues built for swapping or moving funds: almost two-thirds is on DEXs, a quarter on bridges and a tenth on lending markets. Very little appears in products that hold money to earn a return, such as staking, yield and structured products.
The $74M of scam-related volume counts both directions, so it is volume, not money that moved into DeFi: a swap puts one leg in and one leg out.
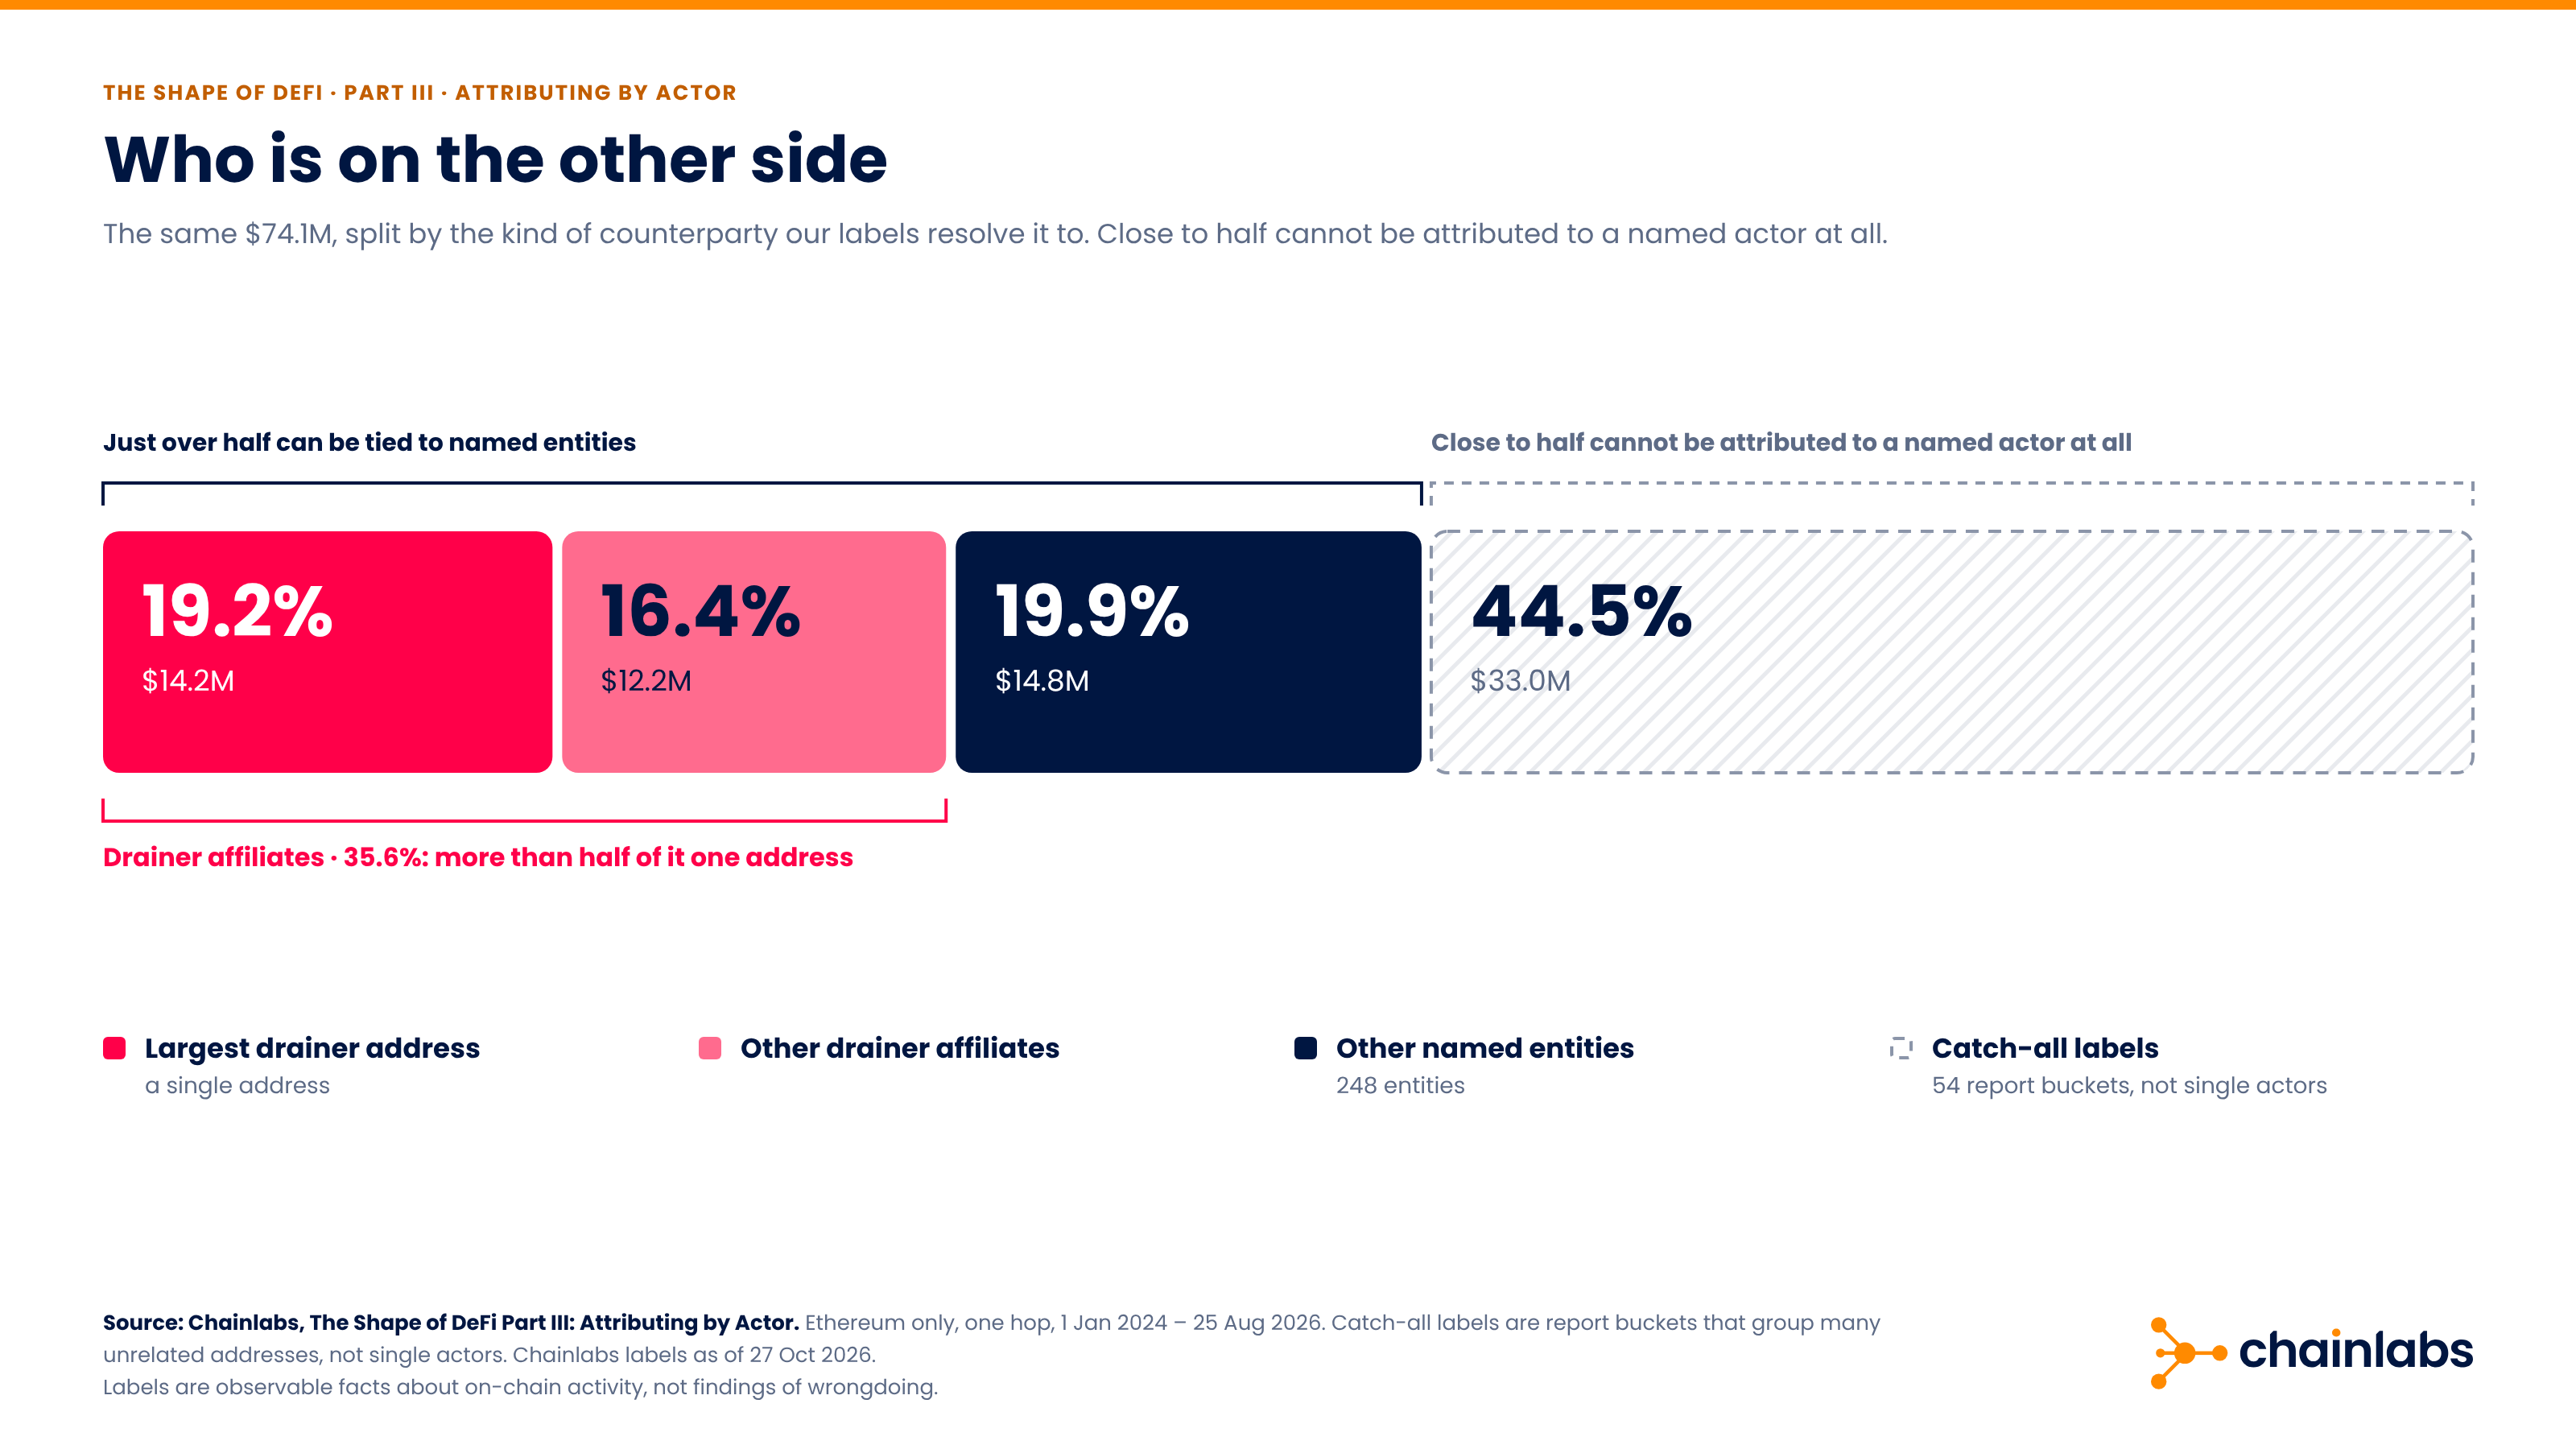
Just over half of the scam-related volume can be tied to named entities. Just over a third belongs to drainer-family entities (drainers are phishing kits, often rented out to affiliates, that trick victims into signing transactions that empty their wallets), a fifth to other named entities, and the remaining 45% sits under catch-all labels that cannot be tied to a single actor.
Just over half of that drainer total comes from a single address. Without it, the rest of the drainer-family entities account for about one sixth of all scam-related volume.
Catch-all labels look more spread out than named entities only because each one groups about ten addresses together.
Guillaume Donnet, Solutions Analyst at Chainlabs, puts it simply: "When we can resolve an address to a named entity, the behaviour turns out to be simple: one venue, usually once. The part that looks messy is mostly report labels that group many unrelated addresses under a single name."
It shows money arriving, changing form on a DEX and leaving through a bridge. In December 2025 the U.S. Securities and Exchange Commission sued three purported crypto trading platforms, among them Morocoin Tech Corp., and four "investment clubs". It alleges a scheme that took at least $14 million from U.S. retail investors between January 2024 and January 2025. The complaint lists the crypto addresses that, it says, received the money: six on Ethereum, four on Bitcoin and five on TRON. Our data labels the six Ethereum addresses.
Between February 2024 and early 2025 those six addresses received about $18 million in stablecoins and some 1,350 ETH from addresses outside the group; who sent it is not visible on chain. The ETH was sold for USDT on Tokenlon, a DEX, and the money was pooled into a few of the six addresses.
From there about $12.8 million left Ethereum through Transit Swap and the SWFT cross-chain bridge. The bridge's own records name where each transfer was going: $12.1 million was sent to TRON as USDT, $11.9 million of it to four TRON addresses. All four are among the five the complaint lists.
The case also shows the limit of a one-hop view. Counting only direct transfers between these addresses and the DeFi contracts in our catalogue at the time, it accounts for $3.8 million. The rest moved through contracts not yet catalogued, so the totals in this study are a floor.
They spread wider. Measured the same way, addresses labelled as exploit-related in our data show about $161M of stablecoin volume with DeFi contracts over the same period, from 166 addresses, plus about 12,985 ETH. A single incident accounts for more than two-fifths of that.
Exploit entities touch about twice as many protocols as scam entities: 2.54 on average, versus 1.1 to 1.3 for the scam entities we can name.
Set side by side, the two cohorts look very different: about $74M from 1,366 scam addresses, and about $161M from 166 exploit addresses. Because one incident carries so much of the exploit figure, an average per address would mean little. The ETH is reported in ether, as in Part II, and is never converted to dollars or added to the stablecoin figure.
These are the exploits we have labelled, not every exploit. Our exploit labels are a separate and newer set from our scam labels, and the two barely overlap: of 702 labelled Ethereum exploit addresses, only two appear in the scam data.
Money arrived from another chain and was fed straight into a DEX. Cetus, a DEX on the Sui network, was exploited on 22 May 2025. Public reporting puts the loss at about $220M to $223M, with roughly $162M frozen by Sui validators, according to The Defiant, Cointelegraph and The Block.
What we see is the Ethereum leg of an exploit that happened on another chain. Between 10:48 and 12:01 UTC, about $40.9M in USDC arrived at an address our data labels as Cetus Exploit: $34M through Mayan, a cross-chain bridge, in 34 payments of almost exactly $1M inside half an hour, and $6.9M from Sui through Circle's Cross-Chain Transfer Protocol (CCTP), which moves USDC between chains by burning it on one chain and minting it on the other. Between 10:51 and 12:20, $35.9M of it went into CoW Protocol, in transfers that grew from $1-2M to $5M and more.
"No single transfer here would stand out on its own. It's the shape that gives it away: round amounts, a half-hour window, and swaps into the DEX getting bigger as the payments cleared," says Martín Jofré, Lead Analyst at Chainlabs. "For anyone monitoring a bridge or a DEX, the window to act on a pattern like that is under two hours."
What left CoW Protocol is not visible in our data. CoW pays out through internal calls inside its settlement contract, which the dataset used here doesn't capture, so we can't yet infer where the money went next.
What makes the route visible at all is the data behind it. "We can describe the Cetus route only because two independent catalogues line up: our DeFi labels name both the bridge and the DEX, and the exploit address comes from a separate trace set built a different way," Donnet explains. "Remove either one and the ninety minutes is just unattributed traffic."
The two studies measure different things, so the comparison has limits. Part II showed one operator running thousands of addresses through a mixer, across layer 2 networks (separate networks that process transactions and settle back to Ethereum) and back again. This study measures one direct hop, so it cannot show what happened to this money before or after it. At that hop, named scam entities use one venue and exploit entities spread out.
Scams and exploits call for different controls. Named scam entities use a single DEX or bridge, so those venues are where most scam-related volume shows up. Exploit funds move faster and across more protocols, so no single venue sees the whole route. Catching them depends on the exploit address already being labelled when the funds arrive.
In both cases, the label on the address is what turns a transfer into an alert. A $1M payment from an unlabelled address looks like routine traffic. The same payment from a labelled drainer affiliate or exploit address is a reason to stop and look.
The three parts show that a pattern is only as useful as the data naming the actor behind it. Part I showed that ranking DeFi by assets held misses what protocols actually do. Part II showed that one busy operator can look like a market-wide trend until you break the figure down.
Part III finds the same thing twice. Set aside one address and the drainer share of scam volume roughly halves. Set aside one incident, and the exploit figure falls by more than two-fifths. And close to half of the scam volume cannot be attributed to a named actor at all. You can only identify the actor behind a pattern if the data names them. Or, as Jofré puts it: "If you cannot name who is behind a flow, you cannot tell whether you are looking at one actor or two hundred." To see how Chainlabs data can be used, visit our Solutions page.
The Shape of DeFi is a three-part series built on Chainlabs' internal taxonomy.
Want to use this data in your own investigations? Book a call with our team.
Research & Data: Martín Jofré, Lead Analyst, and Guillaume Donnet, Solutions Analyst
Editorial: Scott Mallen